Visualization and monitoring solutions
Visualization and monitoring solutions  /  Monitor SAP HANA®
SAP HANA® logo

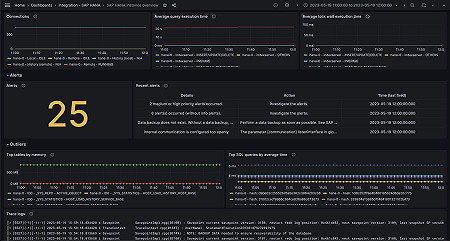
Monitor SAP HANA® easily with Grafana

Easily monitor SAP HANA®, a high-performance, in-memory database designed for analyzing high-speed transactions, with Grafana Cloud’s out-of-the-box monitoring solution. The Grafana Cloud forever-free tier includes 3 users and up to 10k metrics series to support your monitoring needs.
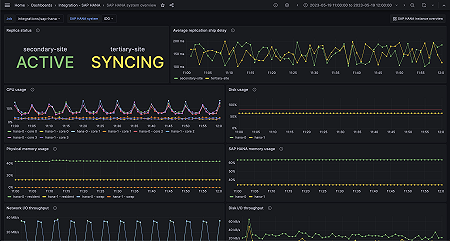
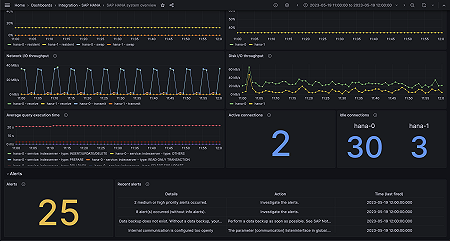
Key metrics included

hanadb_alerts_current_rating
hanadb_connections_total_count
hanadb_cpu_busy_percent
hanadb_disk_io_throughput_kb_second
hanadb_disk_total_size_mb
hanadb_disk_total_used_size_mb
hanadb_host_memory_alloc_limit_mb
hanadb_host_memory_physical_total_mb
hanadb_host_memory_resident_mb
hanadb_host_memory_swap_free_mb
hanadb_host_memory_swap_used_mb
hanadb_host_memory_used_total_mb
hanadb_network_receive_rate_kb_per_seconds
hanadb_network_transmission_rate_kb_per_seconds
hanadb_schema_used_memory_mb
hanadb_sql_service_elap_per_exec_avg_ms
hanadb_sql_service_lock_per_exec_ms
hanadb_sql_top_time_consumers_mu
hanadb_sr_replication
hanadb_sr_ship_delay
hanadb_table_cs_top_mem_total_mb
up

Key alerting rules included

SapHanaHighCpuUtilization (Critical)
SapHanaHighPhysicalMemoryUsage (Critical)
SapHanaMemAllocLimitBelowRecommendation (Warning)
SapHanaHighMemoryUsage (Critical)
SapHanaHighDiskUtilization (Critical)
SapHanaHighSqlExecutionTime (Critical)
SapHanaHighReplicationShippingTime (Critical)
SapHanaReplicationStatusError (Critical)