Monitor Raspberry Pi easily with Grafana
With Grafana Cloud’s out-of-the-box monitoring solution, you can easily keep tabs on Raspberry Pi devices by collecting metrics related to Linux-based operating systems, including CPU usage, load average, memory usage, and disk and networking I/O. The Grafana Cloud forever-free tier includes 3 users and up to 10k metrics series to support your monitoring needs.
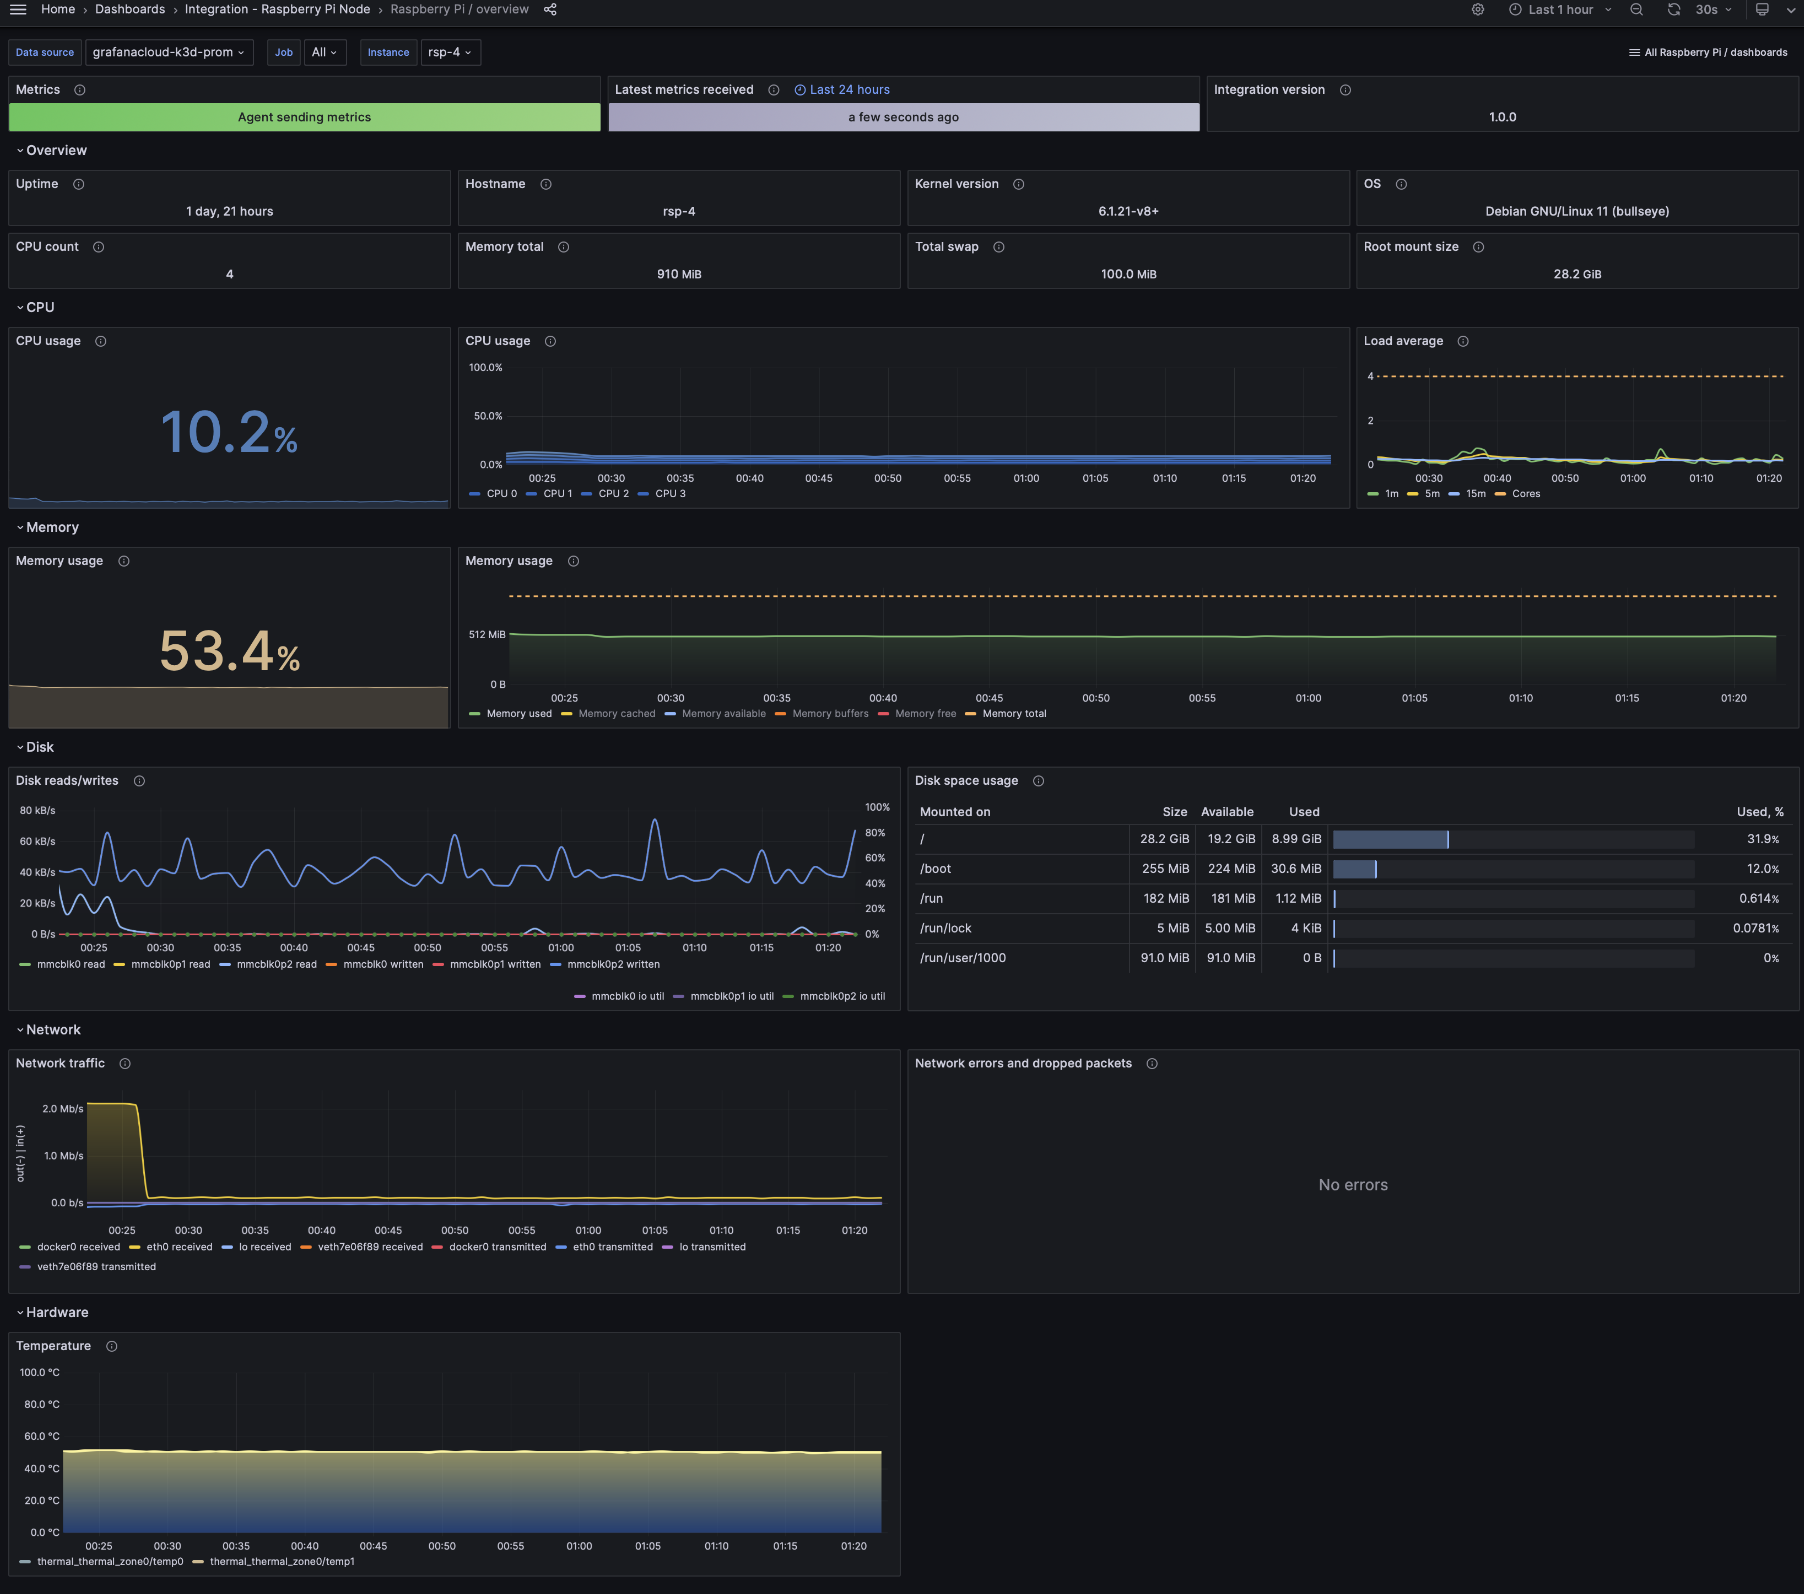
Raspberry Pi integration for Grafana Cloud
The Raspberry Pi integration for Grafana Cloud provides a streamlined way to monitor Raspberry Pi devices using Grafana. It includes dashboards and alerts for metrics such as CPU usage, memory consumption, and disk I/O, making it easy and efficient to track device performance and health.
This integration offers advanced visualization and analysis capabilities, so you can optimize device performance and promptly address issues. You can also use customized alerting to set specific notifications for critical thresholds.
The Raspberry Pi integration comes with 15 pre-configured Prometheus alerts and two ready-made dashboards that utilize over 30 essential metrics to get you started monitoring quickly and efficiently.
Observability signals for Raspberry Pi