Visualization and monitoring integrations
Visualization and monitoring integrations
/
Monitor PgBouncerMonitor PgBouncer easily with Grafana
Easily monitor your deployment of PgBouncer, a lightweight connection pooler for PostgreSQL databases, with Grafana Cloud’s out-of-the-box monitoring solution. The Grafana Cloud forever-free tier includes 3 users and up to 10k metrics series to support your monitoring needs.

PgBouncer cluster overview

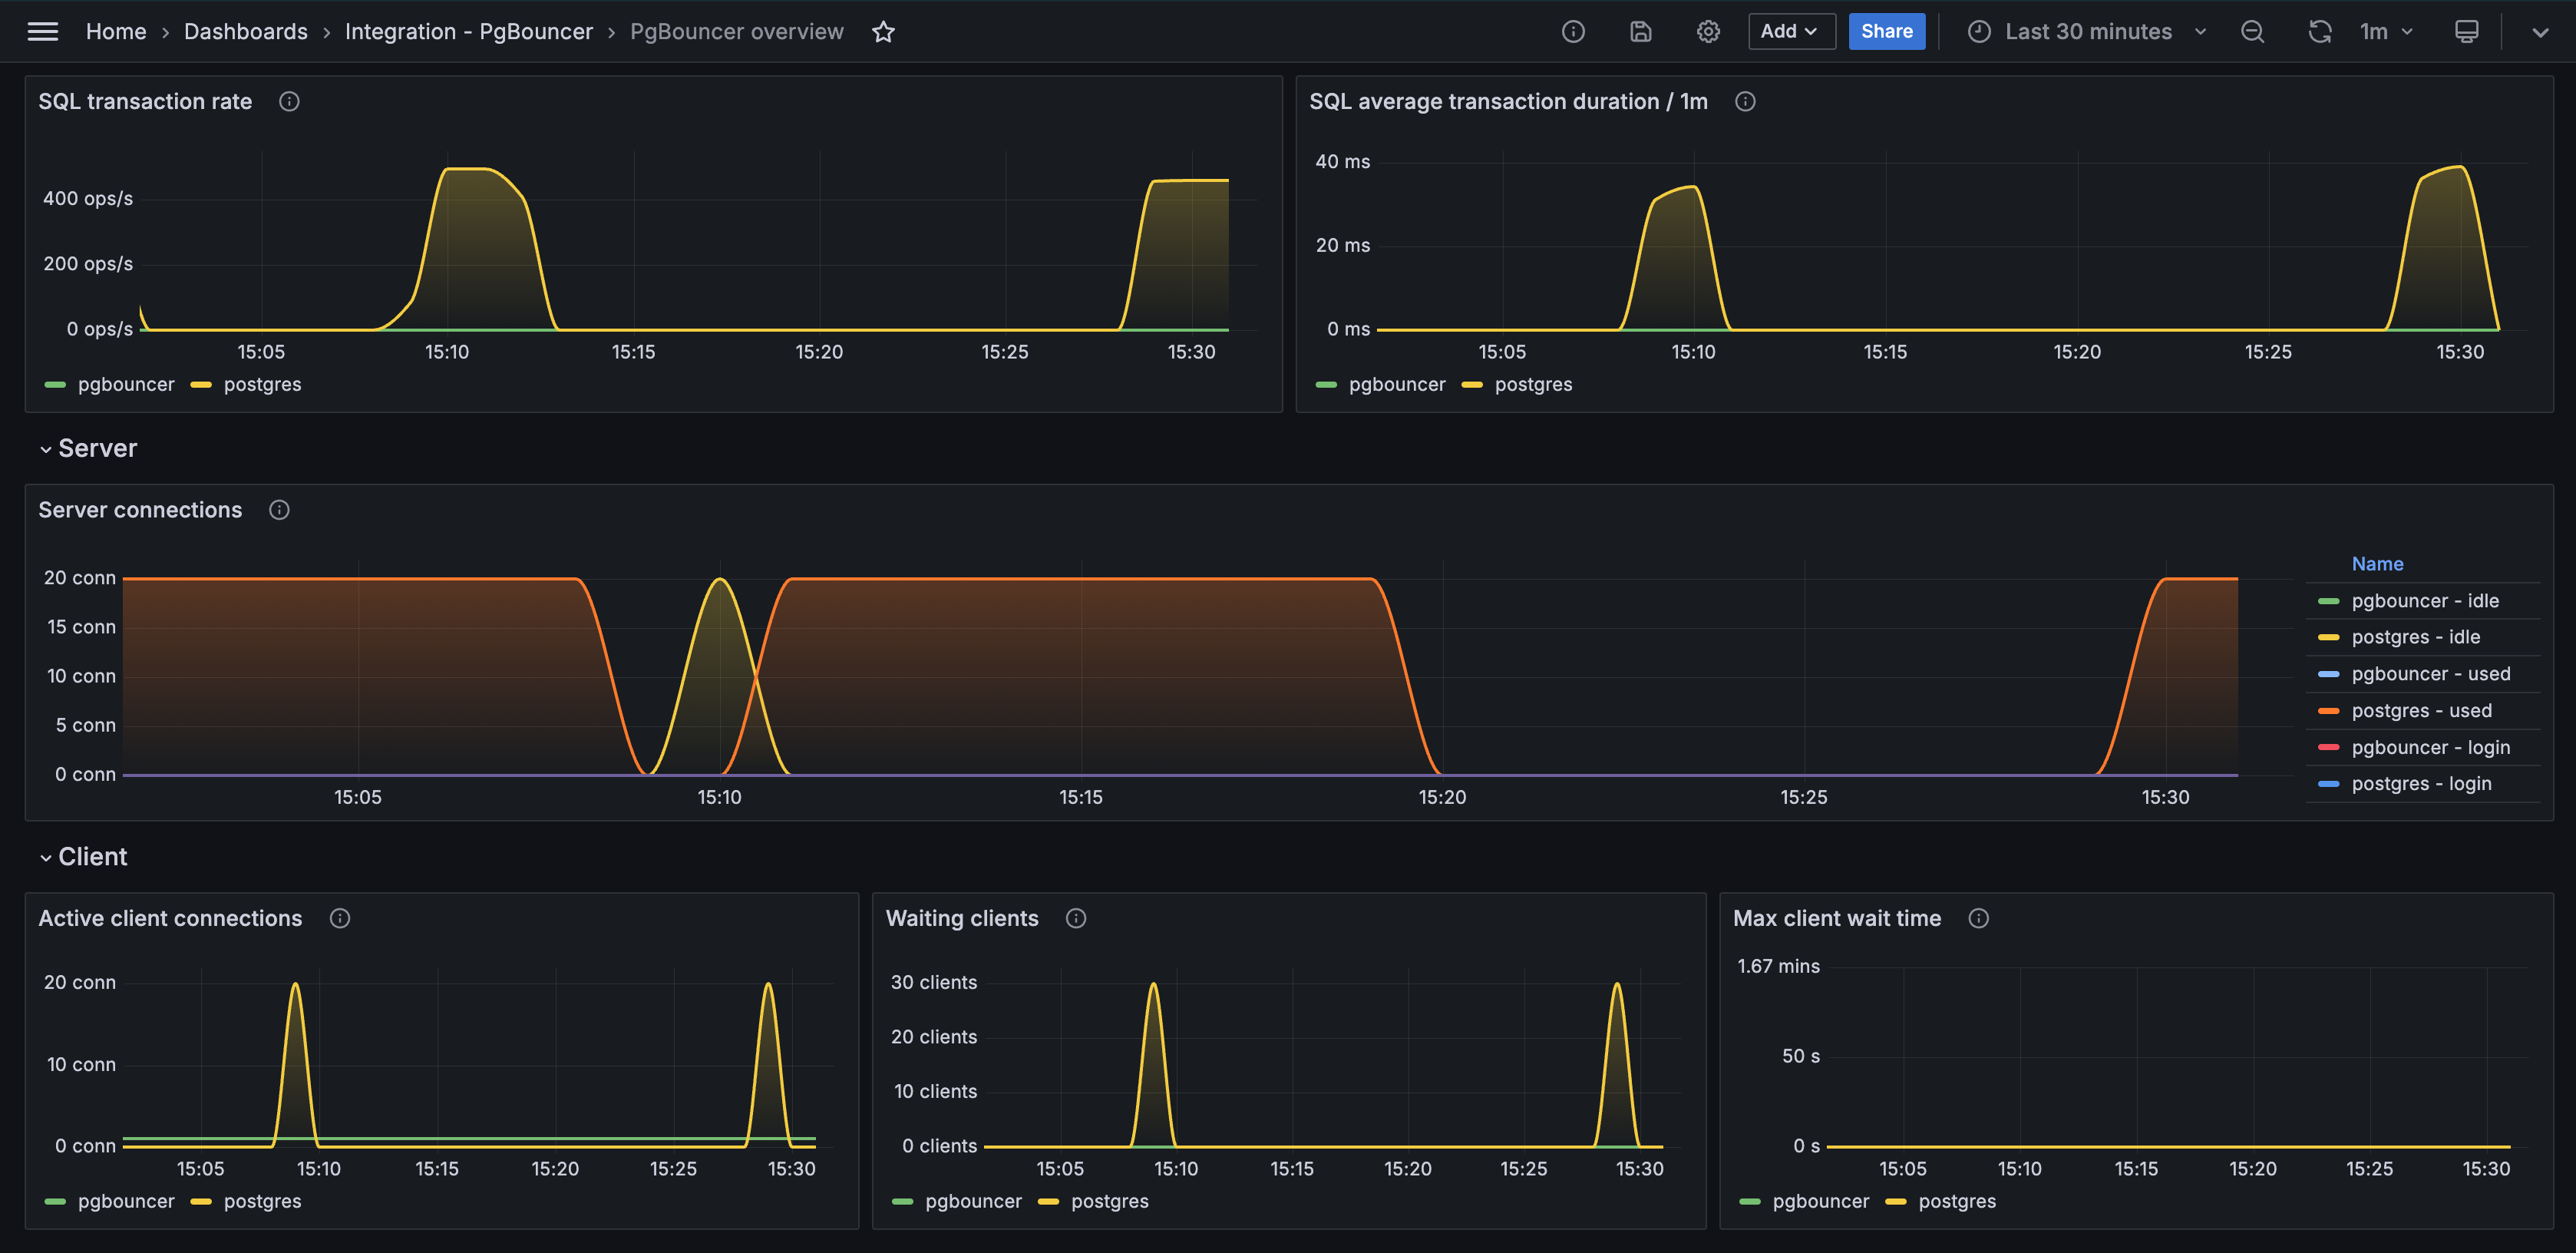
PgBouncer overview
PgBouncer overview (transaction)

PgBouncer logs

PgBouncer logs (continued)
Key metrics
pgbouncer_config_max_client_connections
pgbouncer_config_max_user_connections
pgbouncer_databases_current_connections
pgbouncer_databases_max_connections
pgbouncer_pools_client_active_connections
pgbouncer_pools_client_maxwait_seconds
pgbouncer_pools_client_waiting_connections
pgbouncer_pools_server_active_connections
pgbouncer_pools_server_idle_connections
pgbouncer_pools_server_login_connections
pgbouncer_pools_server_testing_connections
pgbouncer_pools_server_used_connections
pgbouncer_stats_queries_duration_seconds_total
pgbouncer_stats_queries_pooled_total
pgbouncer_stats_received_bytes_total
pgbouncer_stats_sent_bytes_total
pgbouncer_stats_server_in_transaction_seconds_total
pgbouncer_stats_sql_transactions_pooled_total
Key alerting rules included
PGBouncerHighNumberClientWaitingConnections
PGBouncerHighClientWaitTime
PGBouncerHighServerConnectionSaturationWarning
PGBouncerHighServerConnectionSaturationCritical