Visualization and monitoring solutions
Visualization and monitoring solutions  /  Monitor NSQ
NSQ logo

Monitor NSQ easily with Grafana

Easily monitor NSQ, a realtime distributed messaging platform designed to operate at scale, with Grafana Cloud’s out-of-the-box monitoring solution. The Grafana Cloud forever-free tier includes 3 users and up to 10k metrics series to support your monitoring needs.
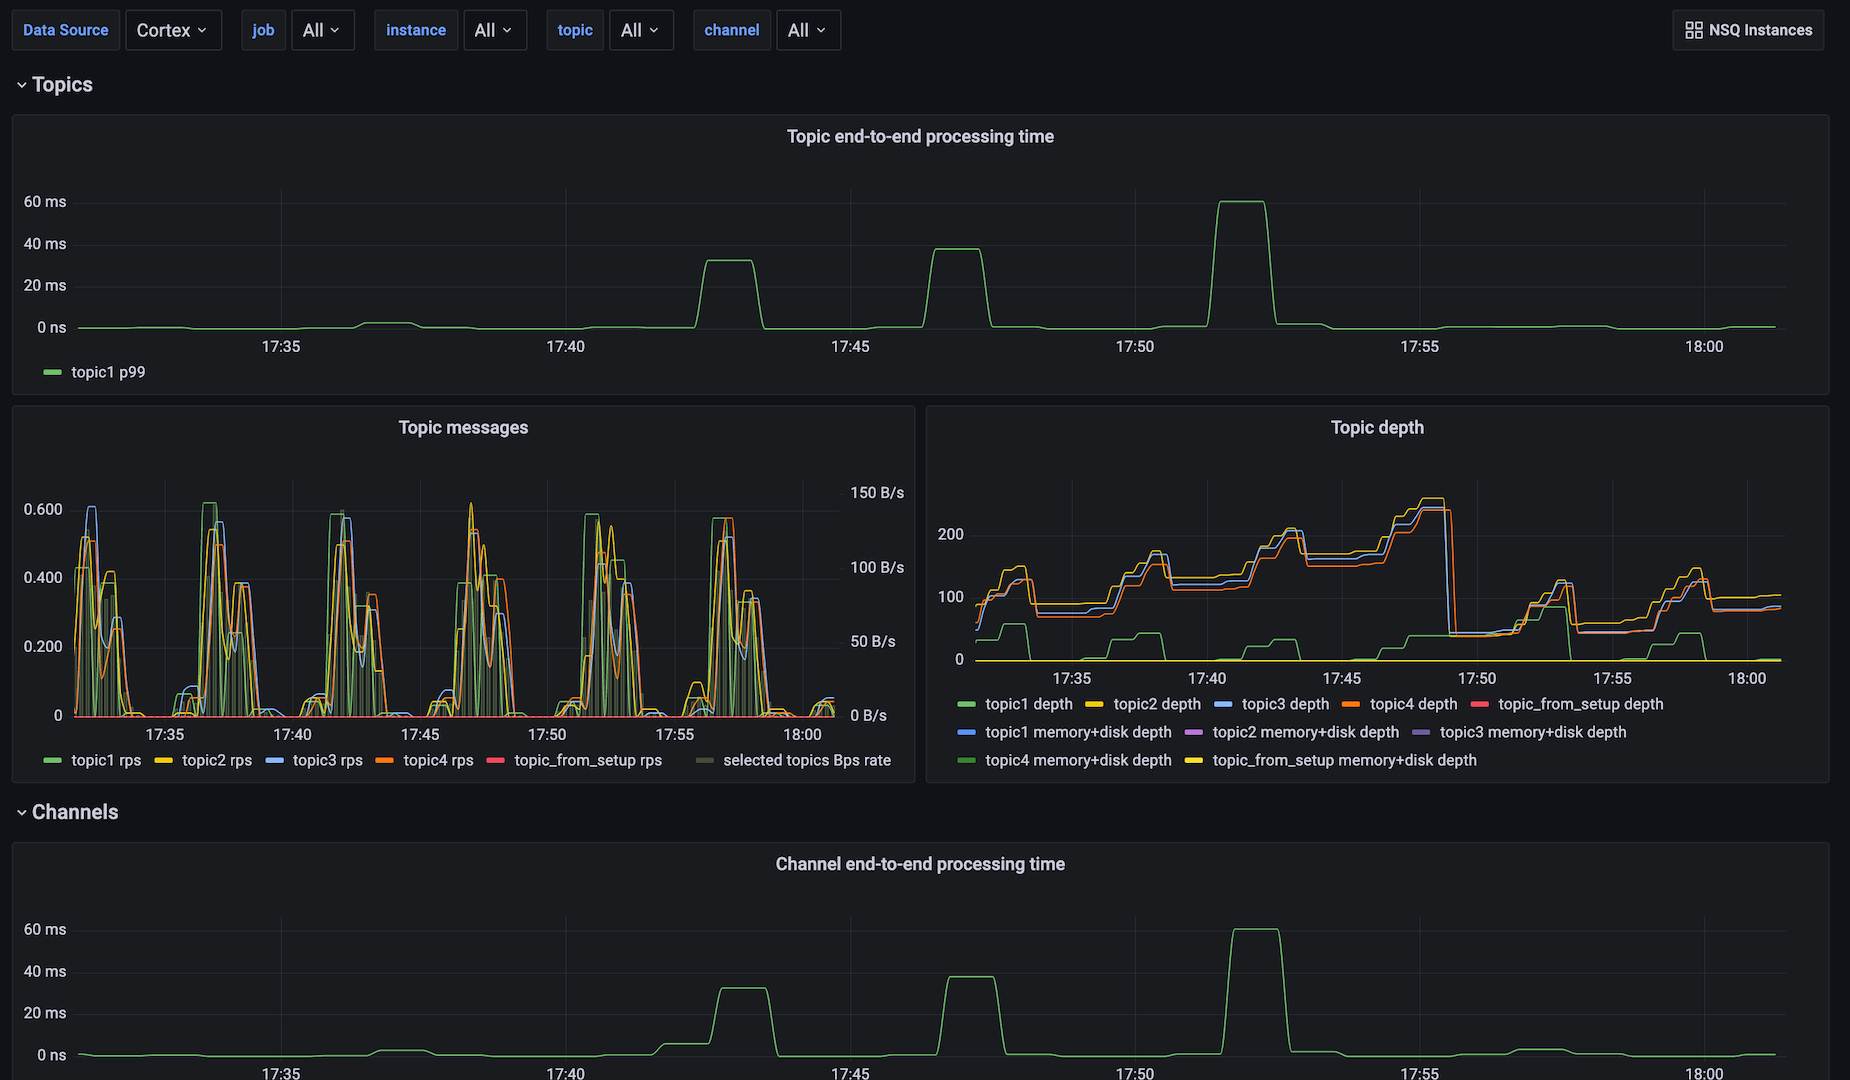
Key metrics included

nsq_mem_gc_pause_usec_100
nsq_mem_gc_pause_usec_95
nsq_mem_gc_pause_usec_99
nsq_mem_heap_idle_bytes
nsq_mem_heap_in_use_bytes
nsq_mem_heap_objects
nsq_mem_heap_released_bytes
nsq_mem_next_gc_bytes
nsq_topic_backend_depth
nsq_topic_channel_backend_depth
nsq_topic_channel_clients
nsq_topic_channel_deferred_count
nsq_topic_channel_depth
nsq_topic_channel_e2e_processing_latency_99
nsq_topic_channel_in_flight_count
nsq_topic_channel_message_count
nsq_topic_channel_requeue_count
nsq_topic_channel_timeout_count
nsq_topic_depth
nsq_topic_e2e_processing_latency_99
nsq_topic_message_bytes
nsq_topic_message_count
up

Key alerting rules included

NsqTopicDepthIncreasing (Critical)
NsqChannelDepthIncreasing (Critical)