Visualization and monitoring solutions
Visualization and monitoring solutions  /  Monitor Grafana Agent
Grafana Agent logo

Monitor Grafana Agent easily with Grafana

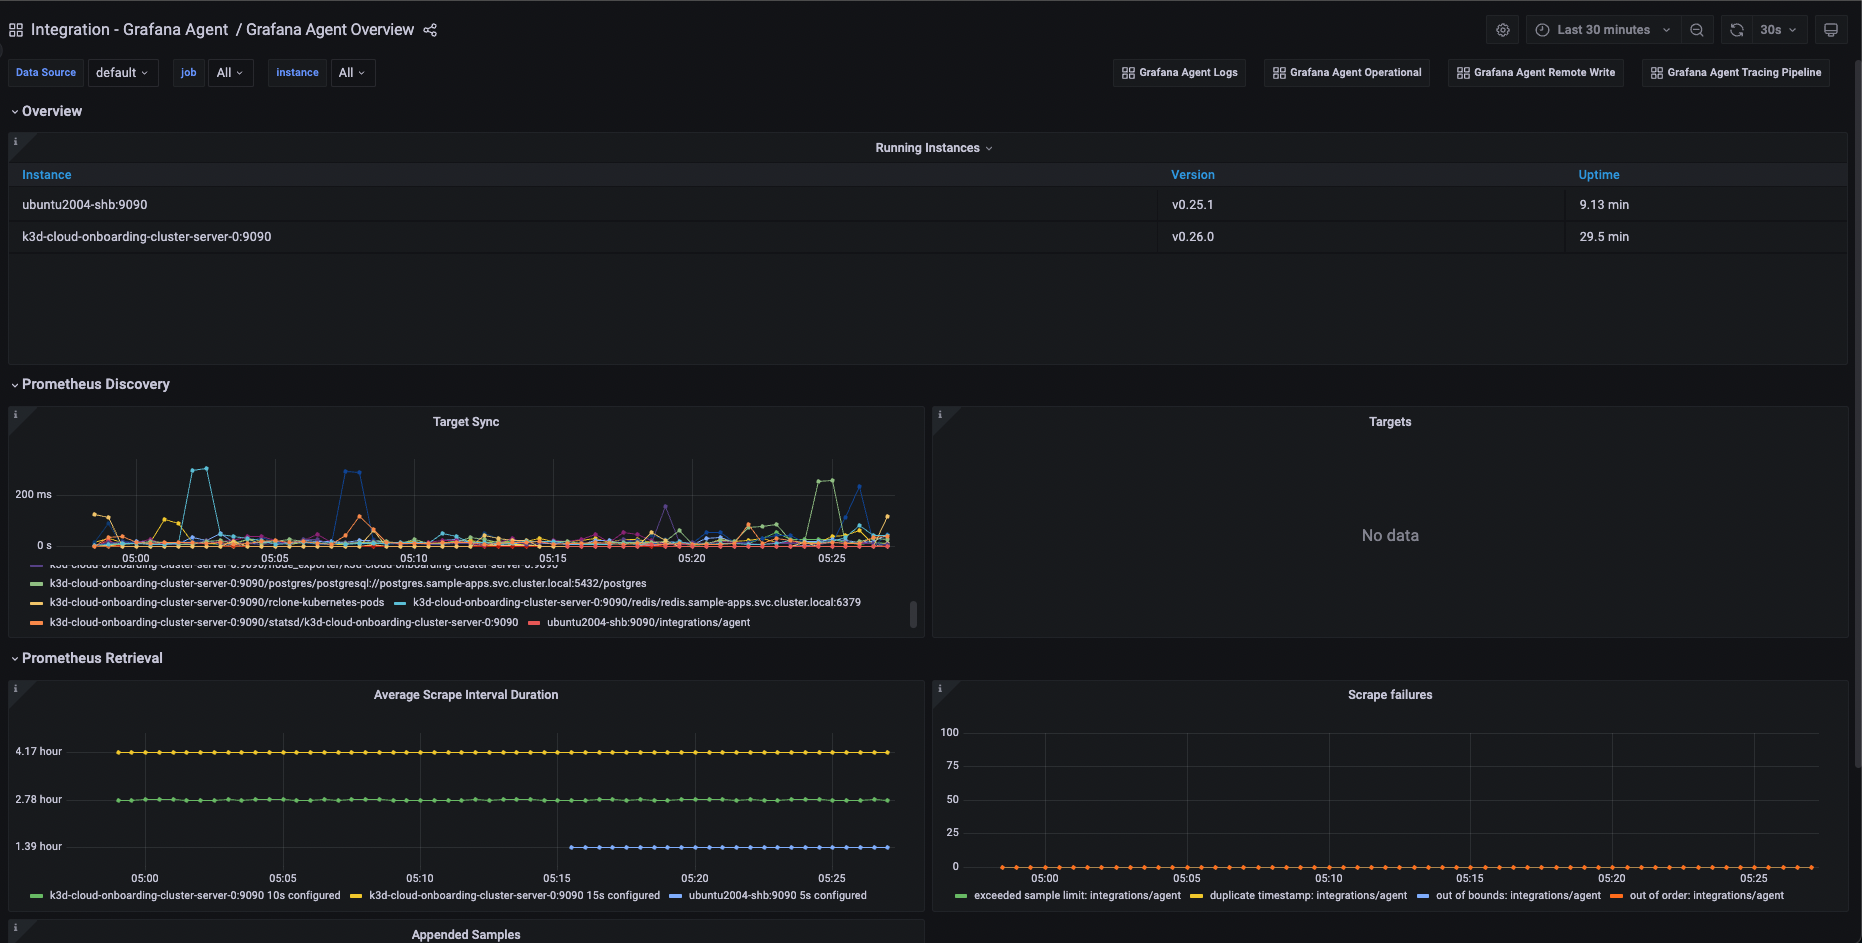
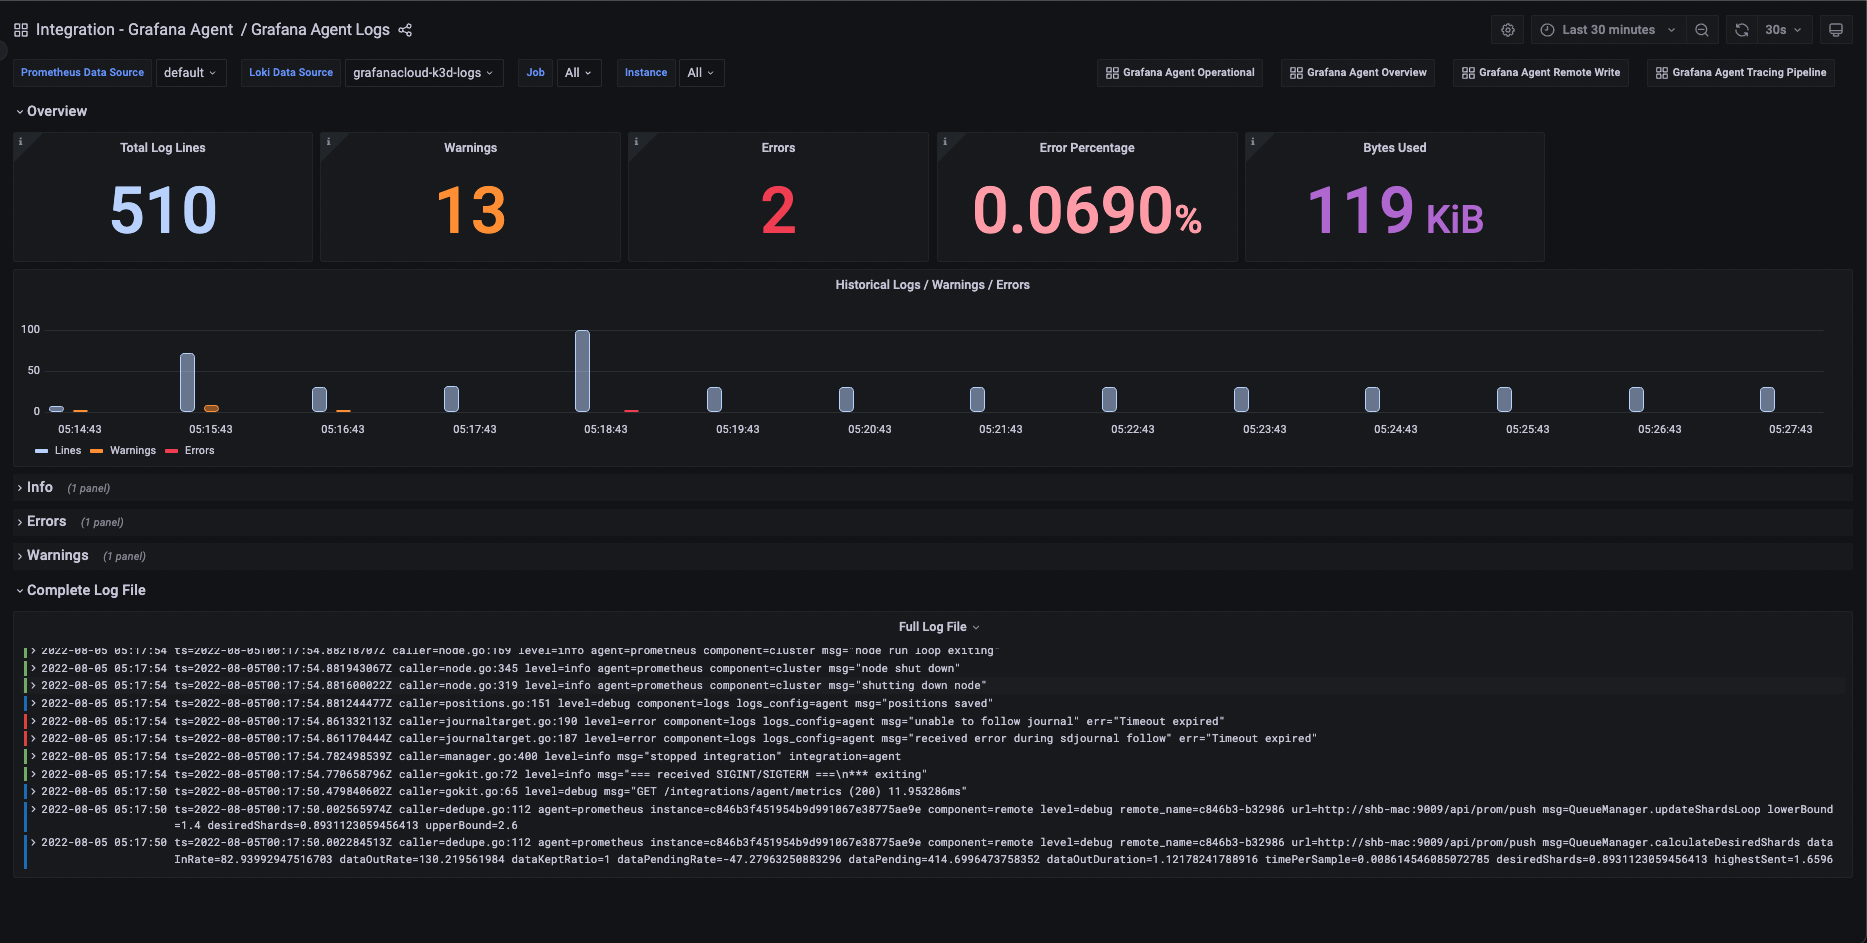
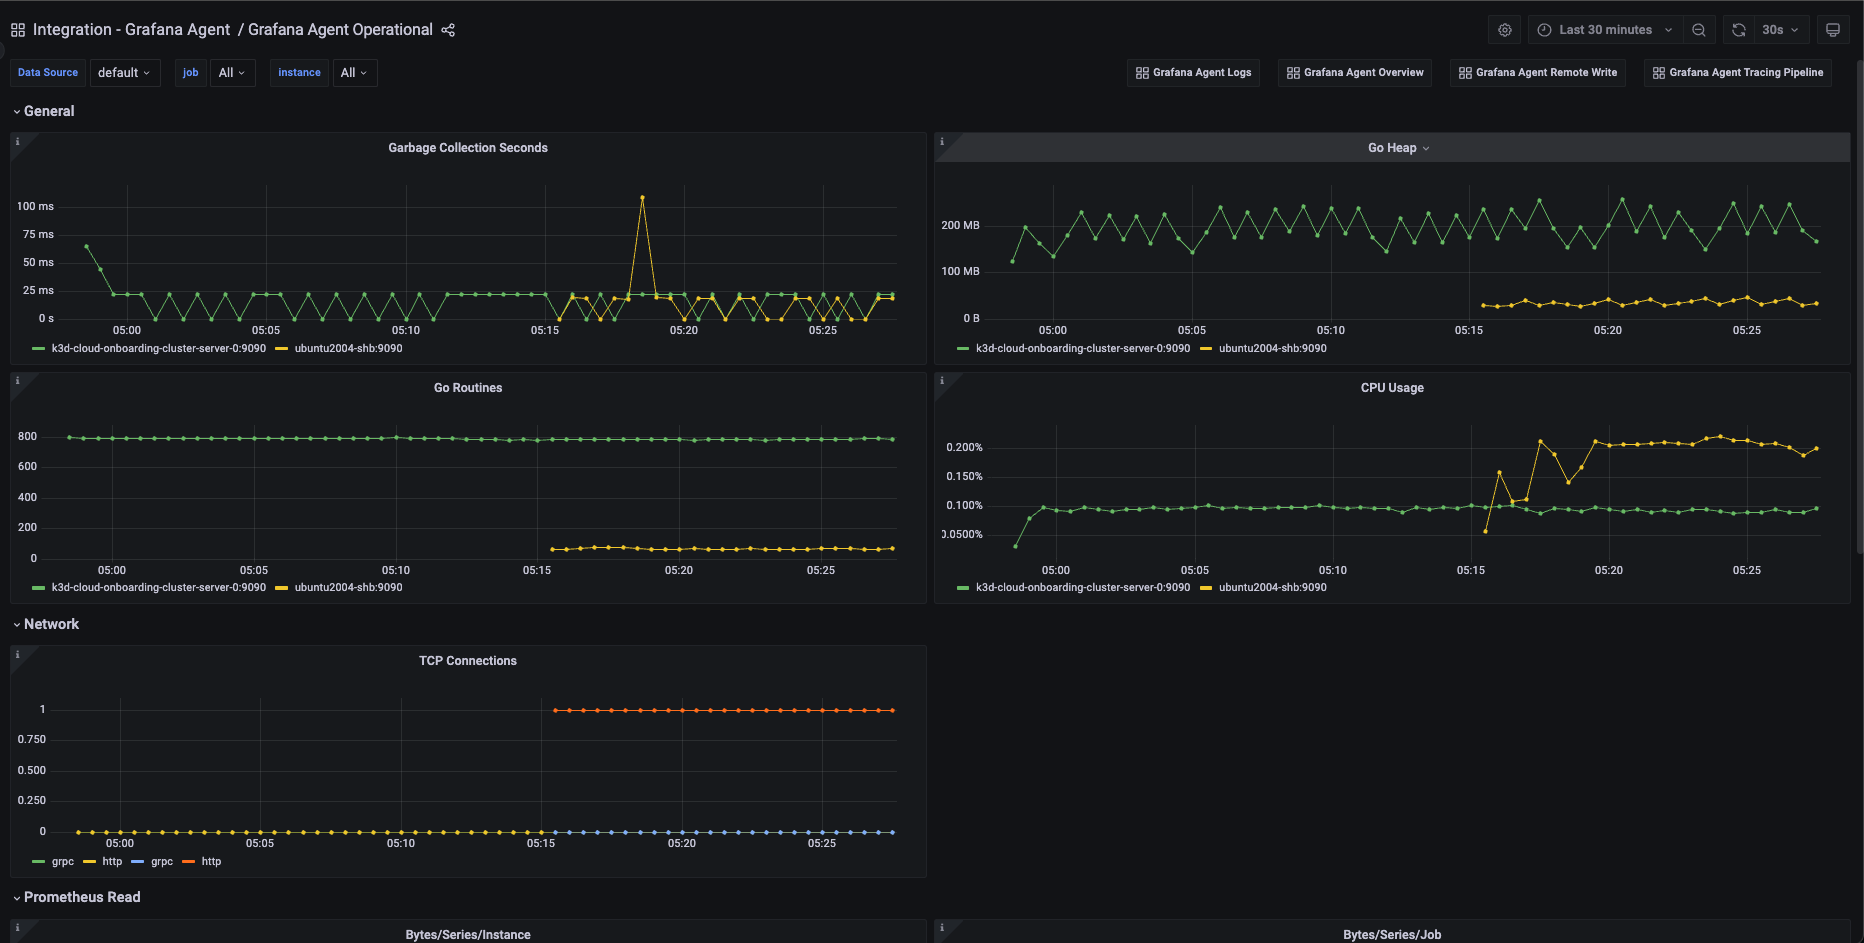
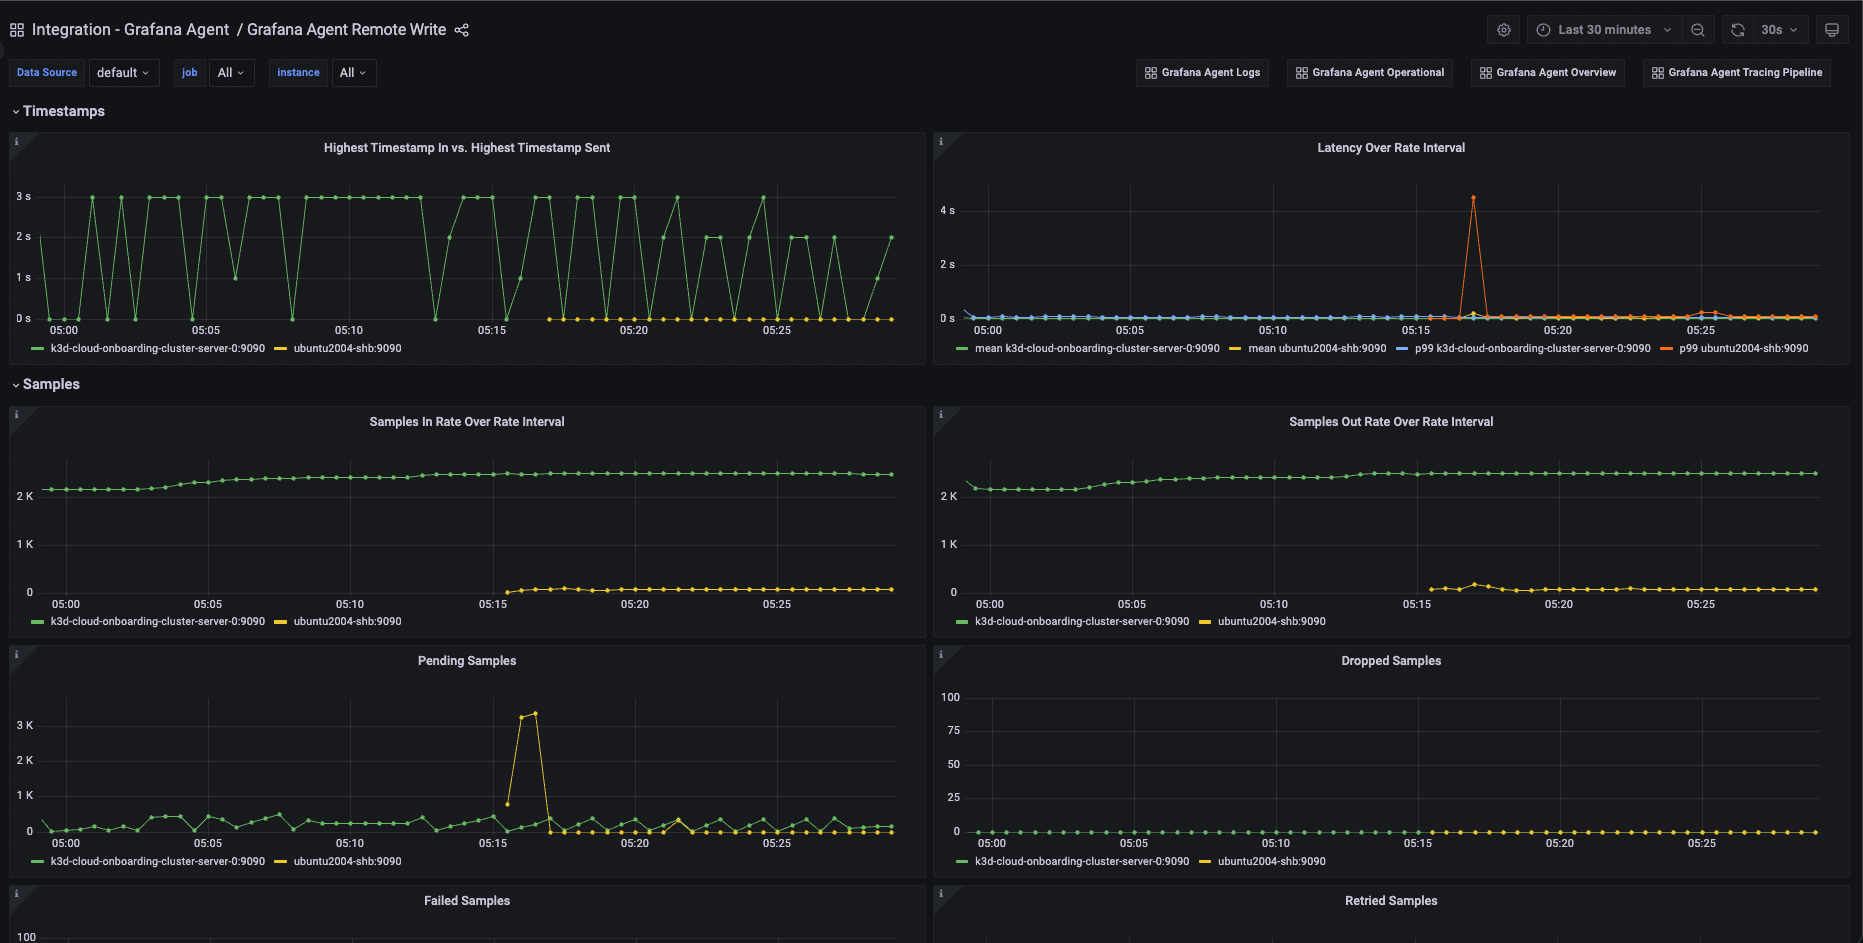
Easily monitor Grafana Agent, the vendor-neutral, batteries-included telemetry collector with configuration inspired by Terraform, with Grafana Cloud’s out-of-the-box monitoring solution. The Grafana Cloud forever-free tier includes 3 users and up to 10k metrics series to support your monitoring needs.

Key metrics included

agent_build_info
agent_tcp_connections
agent_wal_samples_appended_total
agent_wal_storage_active_series
go_gc_duration_seconds_count
go_goroutines
go_memstats_heap_inuse_bytes
process_cpu_seconds_total
process_start_time_seconds
prometheus_remote_storage_enqueue_retries_total
prometheus_remote_storage_highest_timestamp_in_seconds
prometheus_remote_storage_queue_highest_sent_timestamp_seconds
prometheus_remote_storage_samples_dropped_total
prometheus_remote_storage_samples_failed_total
prometheus_remote_storage_samples_pending
prometheus_remote_storage_samples_retried_total
prometheus_remote_storage_samples_total
prometheus_remote_storage_sent_batch_duration_seconds_bucket
prometheus_remote_storage_sent_batch_duration_seconds_count
prometheus_remote_storage_sent_batch_duration_seconds_sum
prometheus_remote_storage_shard_capacity
prometheus_remote_storage_shards
prometheus_remote_storage_shards_desired
prometheus_remote_storage_shards_max
prometheus_remote_storage_shards_min
prometheus_remote_storage_succeeded_samples_total
prometheus_sd_discovered_targets
prometheus_target_interval_length_seconds_count
prometheus_target_interval_length_seconds_sum
prometheus_target_scrapes_exceeded_sample_limit_total
prometheus_target_scrapes_sample_duplicate_timestamp_total
prometheus_target_scrapes_sample_out_of_bounds_total
prometheus_target_scrapes_sample_out_of_order_total
prometheus_target_sync_length_seconds_sum
prometheus_wal_watcher_current_segment
traces_exporter_send_failed_spans_total
traces_exporter_sent_spans_total
traces_receiver_accepted_spans_total
traces_receiver_refused_spans_total
up

Key alerting rules included

GrafanaAgentDown (Critical)
GrafanaAgentUnstable (Warning)
GrafanaAgentCPUHigh (Warning)
GrafanaAgentMemHigh (Warning)