Visualization and monitoring solutions
Visualization and monitoring solutions  /  Monitor Ceph
Ceph logo

Monitor Ceph easily with Grafana

Easily monitor Ceph, which delivers object, block, and file storage in one unified system, with Grafana Cloud’s out-of-the-box monitoring solution. The Grafana Cloud forever-free tier includes 3 users and up to 10k metrics series to support your monitoring needs.

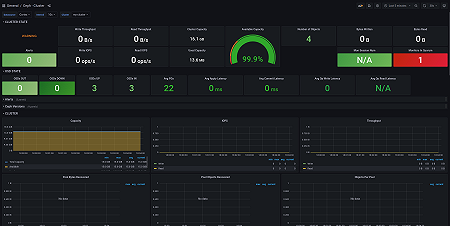
Key metrics included

ceph_bluestore_commit_lat_count
ceph_cluster_total_bytes
ceph_cluster_total_used_bytes
ceph_filestore_journal_latency_count
ceph_health_status
ceph_mds_metadata
ceph_mon_metadata
ceph_mon_num_sessions
ceph_mon_quorum_status
ceph_osd_apply_latency_ms
ceph_osd_commit_latency_ms
ceph_osd_in
ceph_osd_metadata
ceph_osd_numpg
ceph_osd_op_r
ceph_osd_op_r_latency_count
ceph_osd_op_r_latency_sum
ceph_osd_op_r_out_bytes
ceph_osd_op_w
ceph_osd_op_w_in_bytes
ceph_osd_op_w_latency_count
ceph_osd_op_w_latency_sum
ceph_osd_recovery_ops
ceph_osd_up
ceph_pg_active
ceph_pg_backfill
ceph_pg_backfill_toofull
ceph_pg_clean
ceph_pg_creating
ceph_pg_deep
ceph_pg_degraded
ceph_pg_down
ceph_pg_forced_backfill
ceph_pg_forced_recovery
ceph_pg_incomplete
ceph_pg_inconsistent
ceph_pg_peered
ceph_pg_peering
ceph_pg_recovering
ceph_pg_remapped
ceph_pg_repair
ceph_pg_scrubbing
ceph_pg_stale
ceph_pg_undersized
ceph_pg_wait_backfill
ceph_pool_metadata
ceph_pool_num_bytes_recovered
ceph_pool_num_objects_recovered
ceph_pool_objects
ceph_pool_quota_bytes
ceph_pool_quota_objects
ceph_rgw_metadata
ceph_unclean_pgs
up

Key alerting rules included

CephUnhealthyWarning (Warning)
CephUnhealthyCritical (Critical)
CephDiskLessThan15Left (Warning)
CephDiskLessThan5Left (Critical)
OSDNodeDown (Warning)
MDSDown (Warning)