Visualization and monitoring integrations
Visualization and monitoring integrations
/
Monitor CatchpointMonitor Catchpoint easily with Grafana
Easily monitor your deployment of Catchpoint, a digital experience monitoring platform for real-time insights into the performance and availability of websites, applications, and infrastructure, with Grafana Cloud’s out-of-the-box monitoring solution. The Grafana Cloud forever-free tier includes 3 users and up to 10k metrics series to support your monitoring needs.

Catchpoint overview

Catchpoint overview (connectivity)
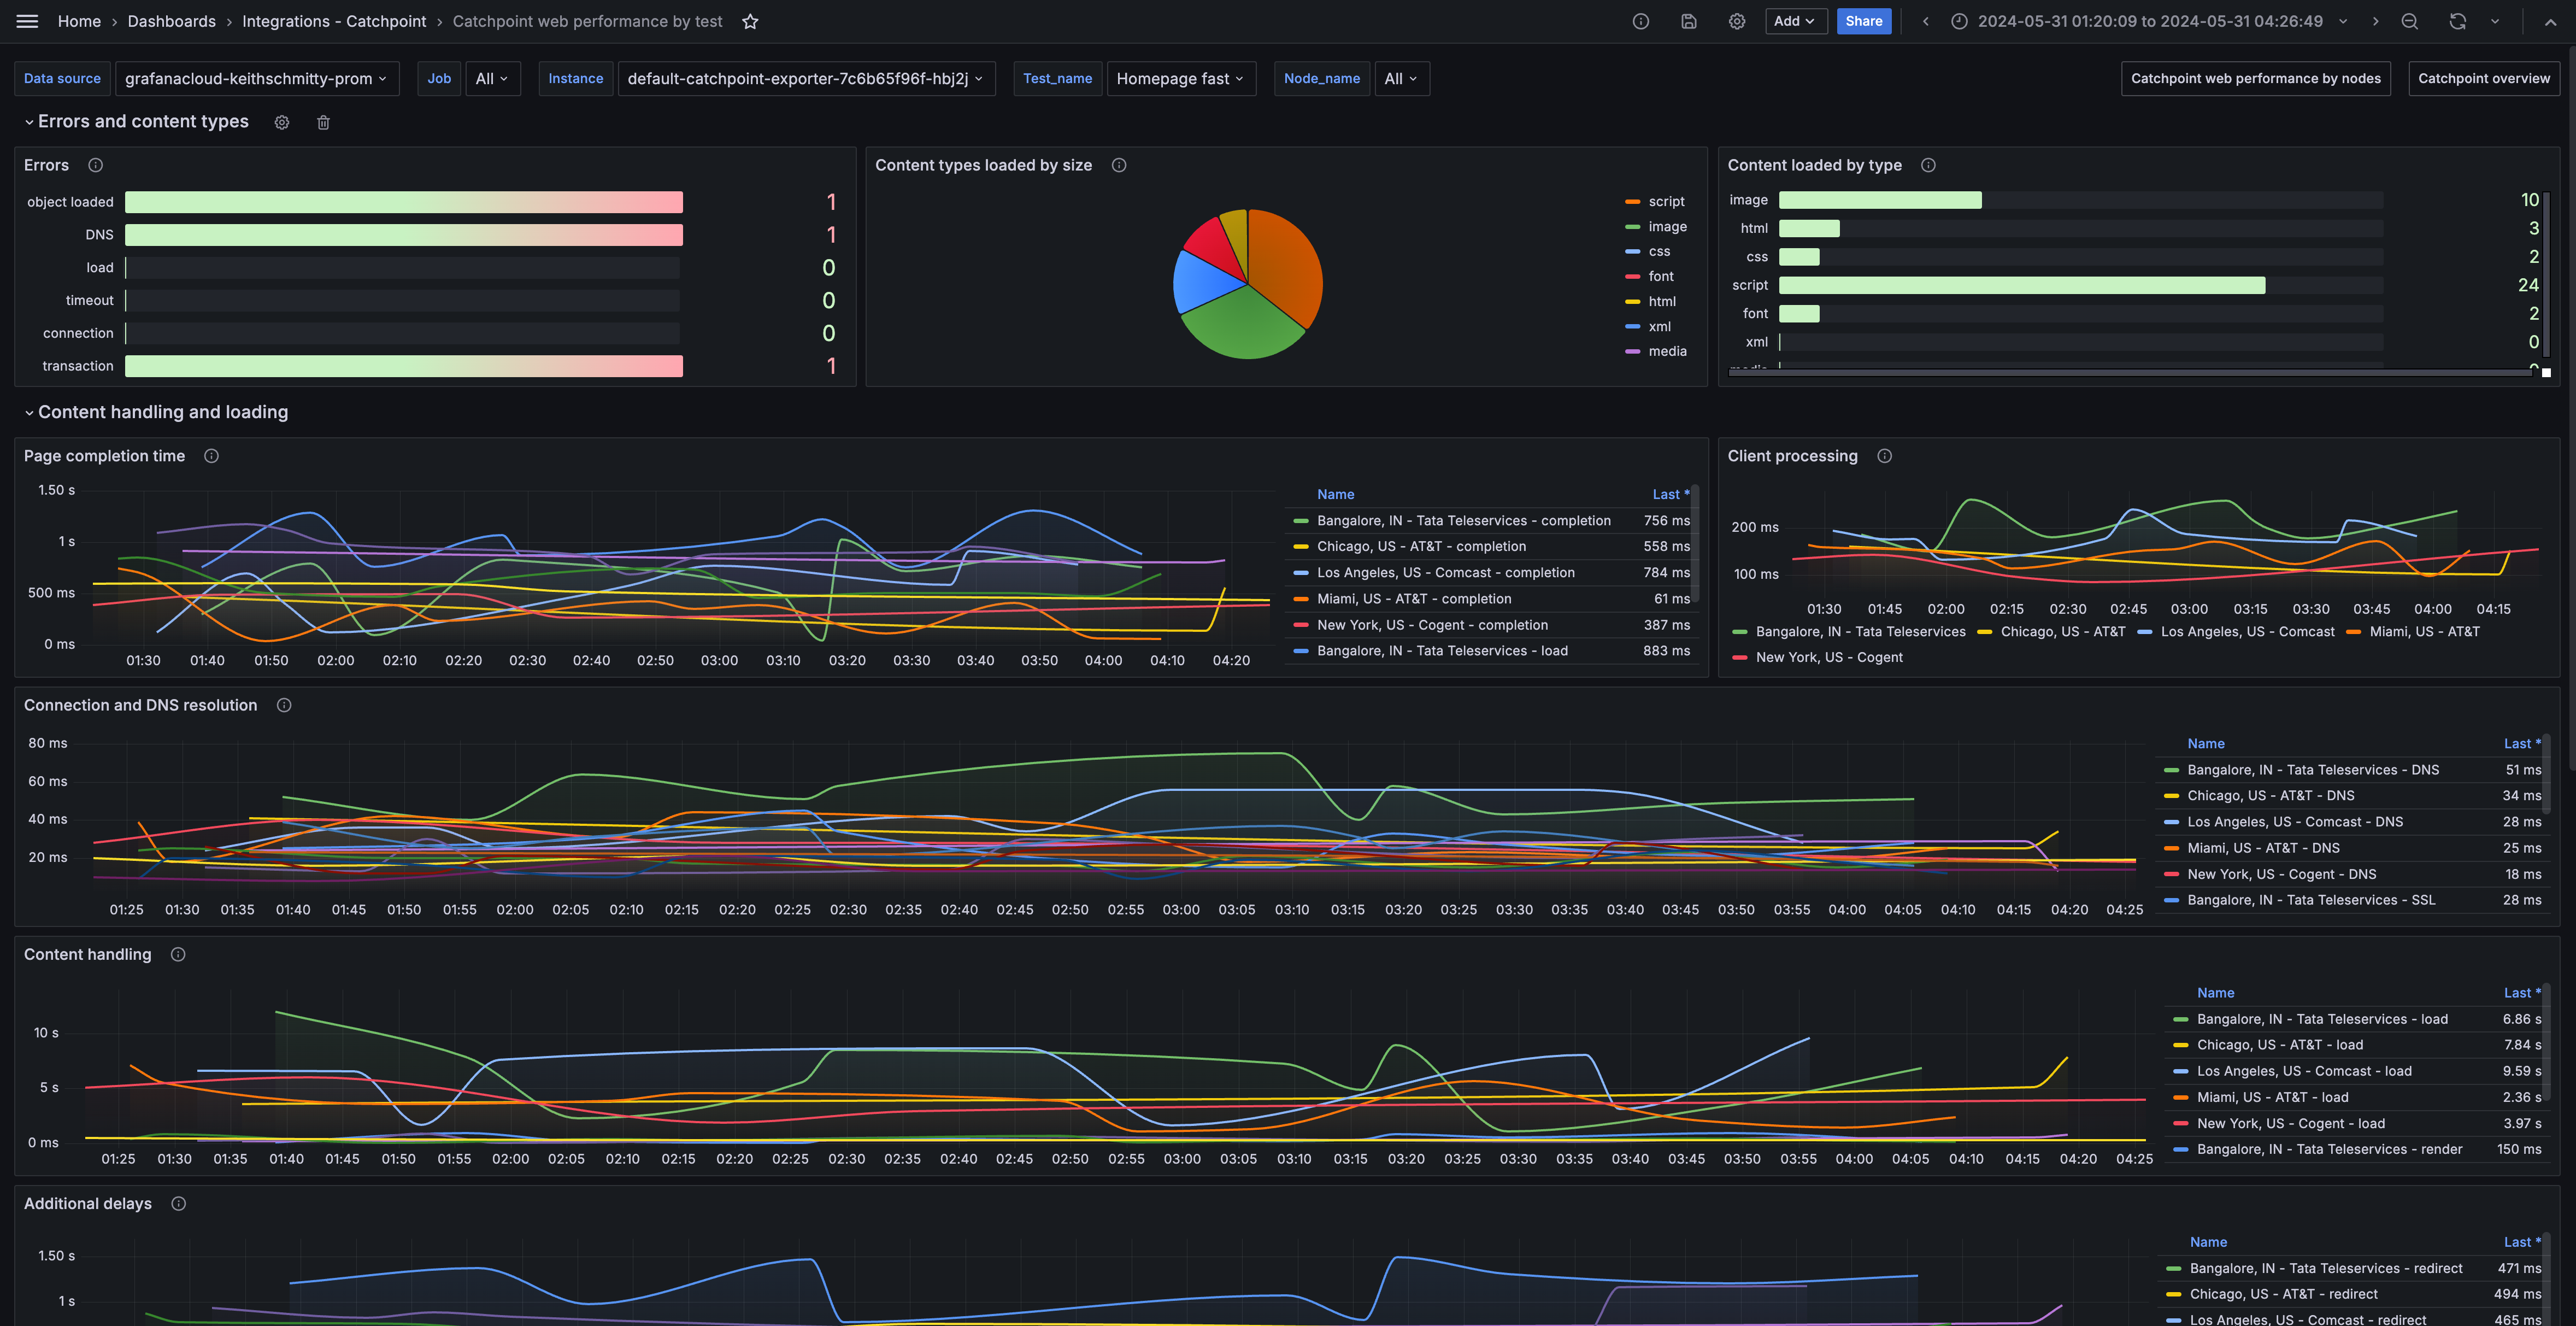
Catchpoint web performance by test
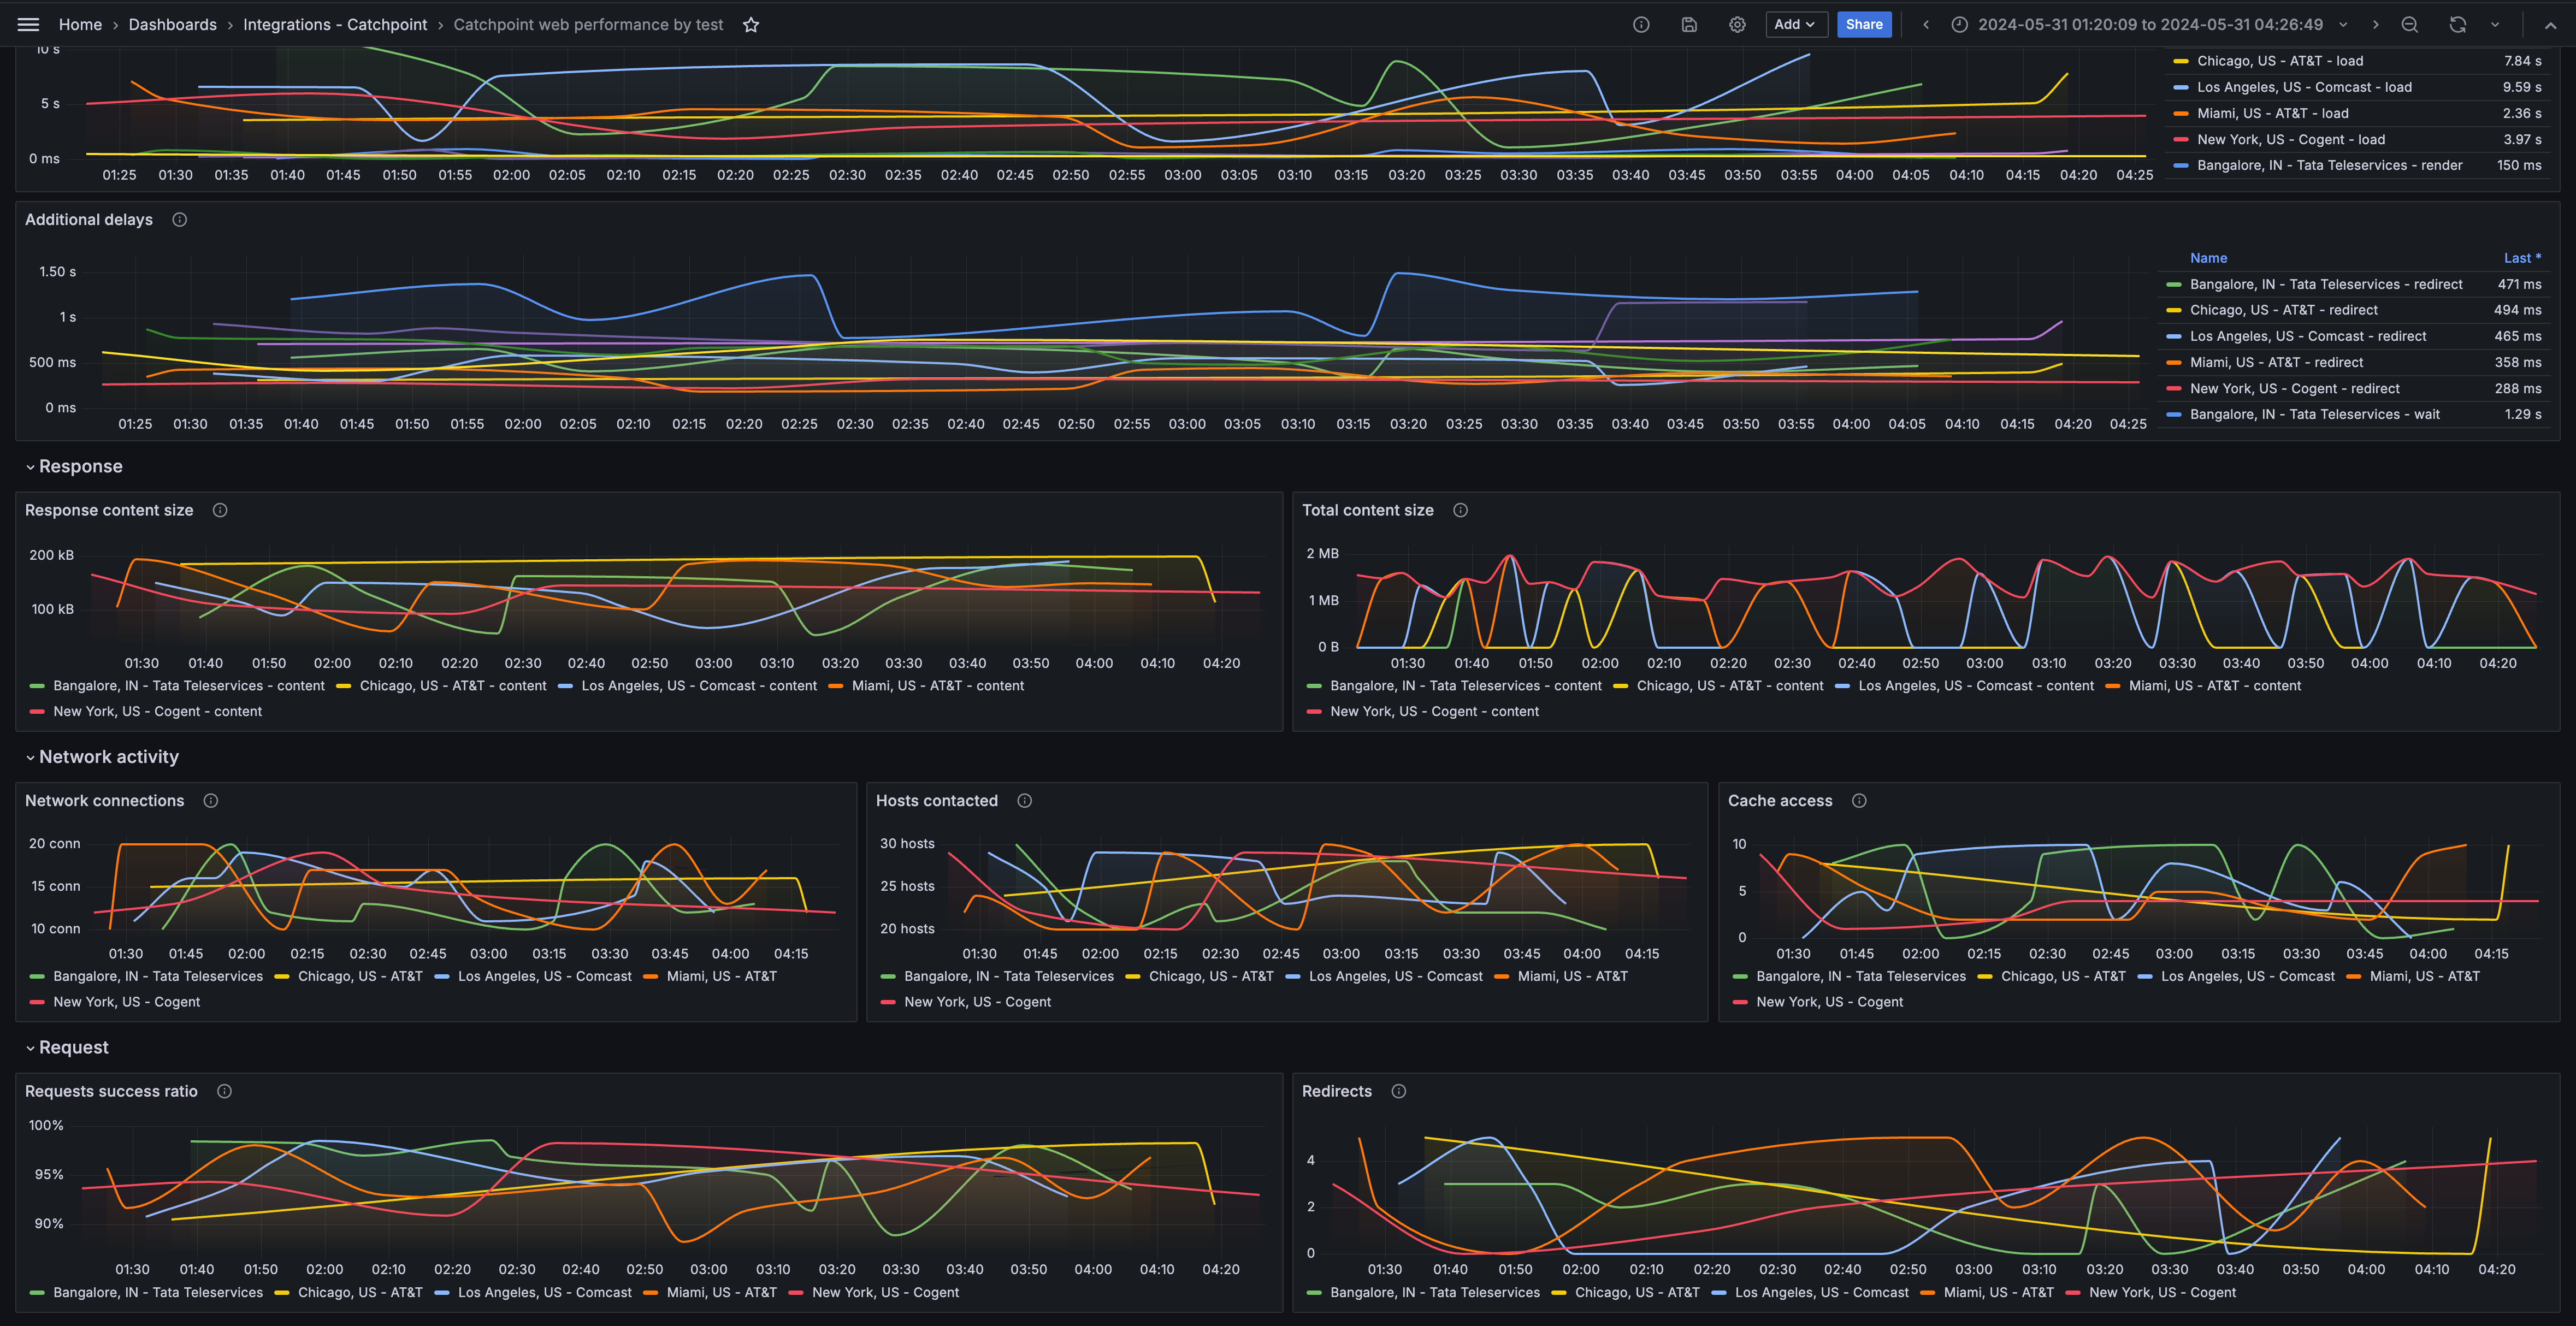
Catchpoint web performance by test (network)
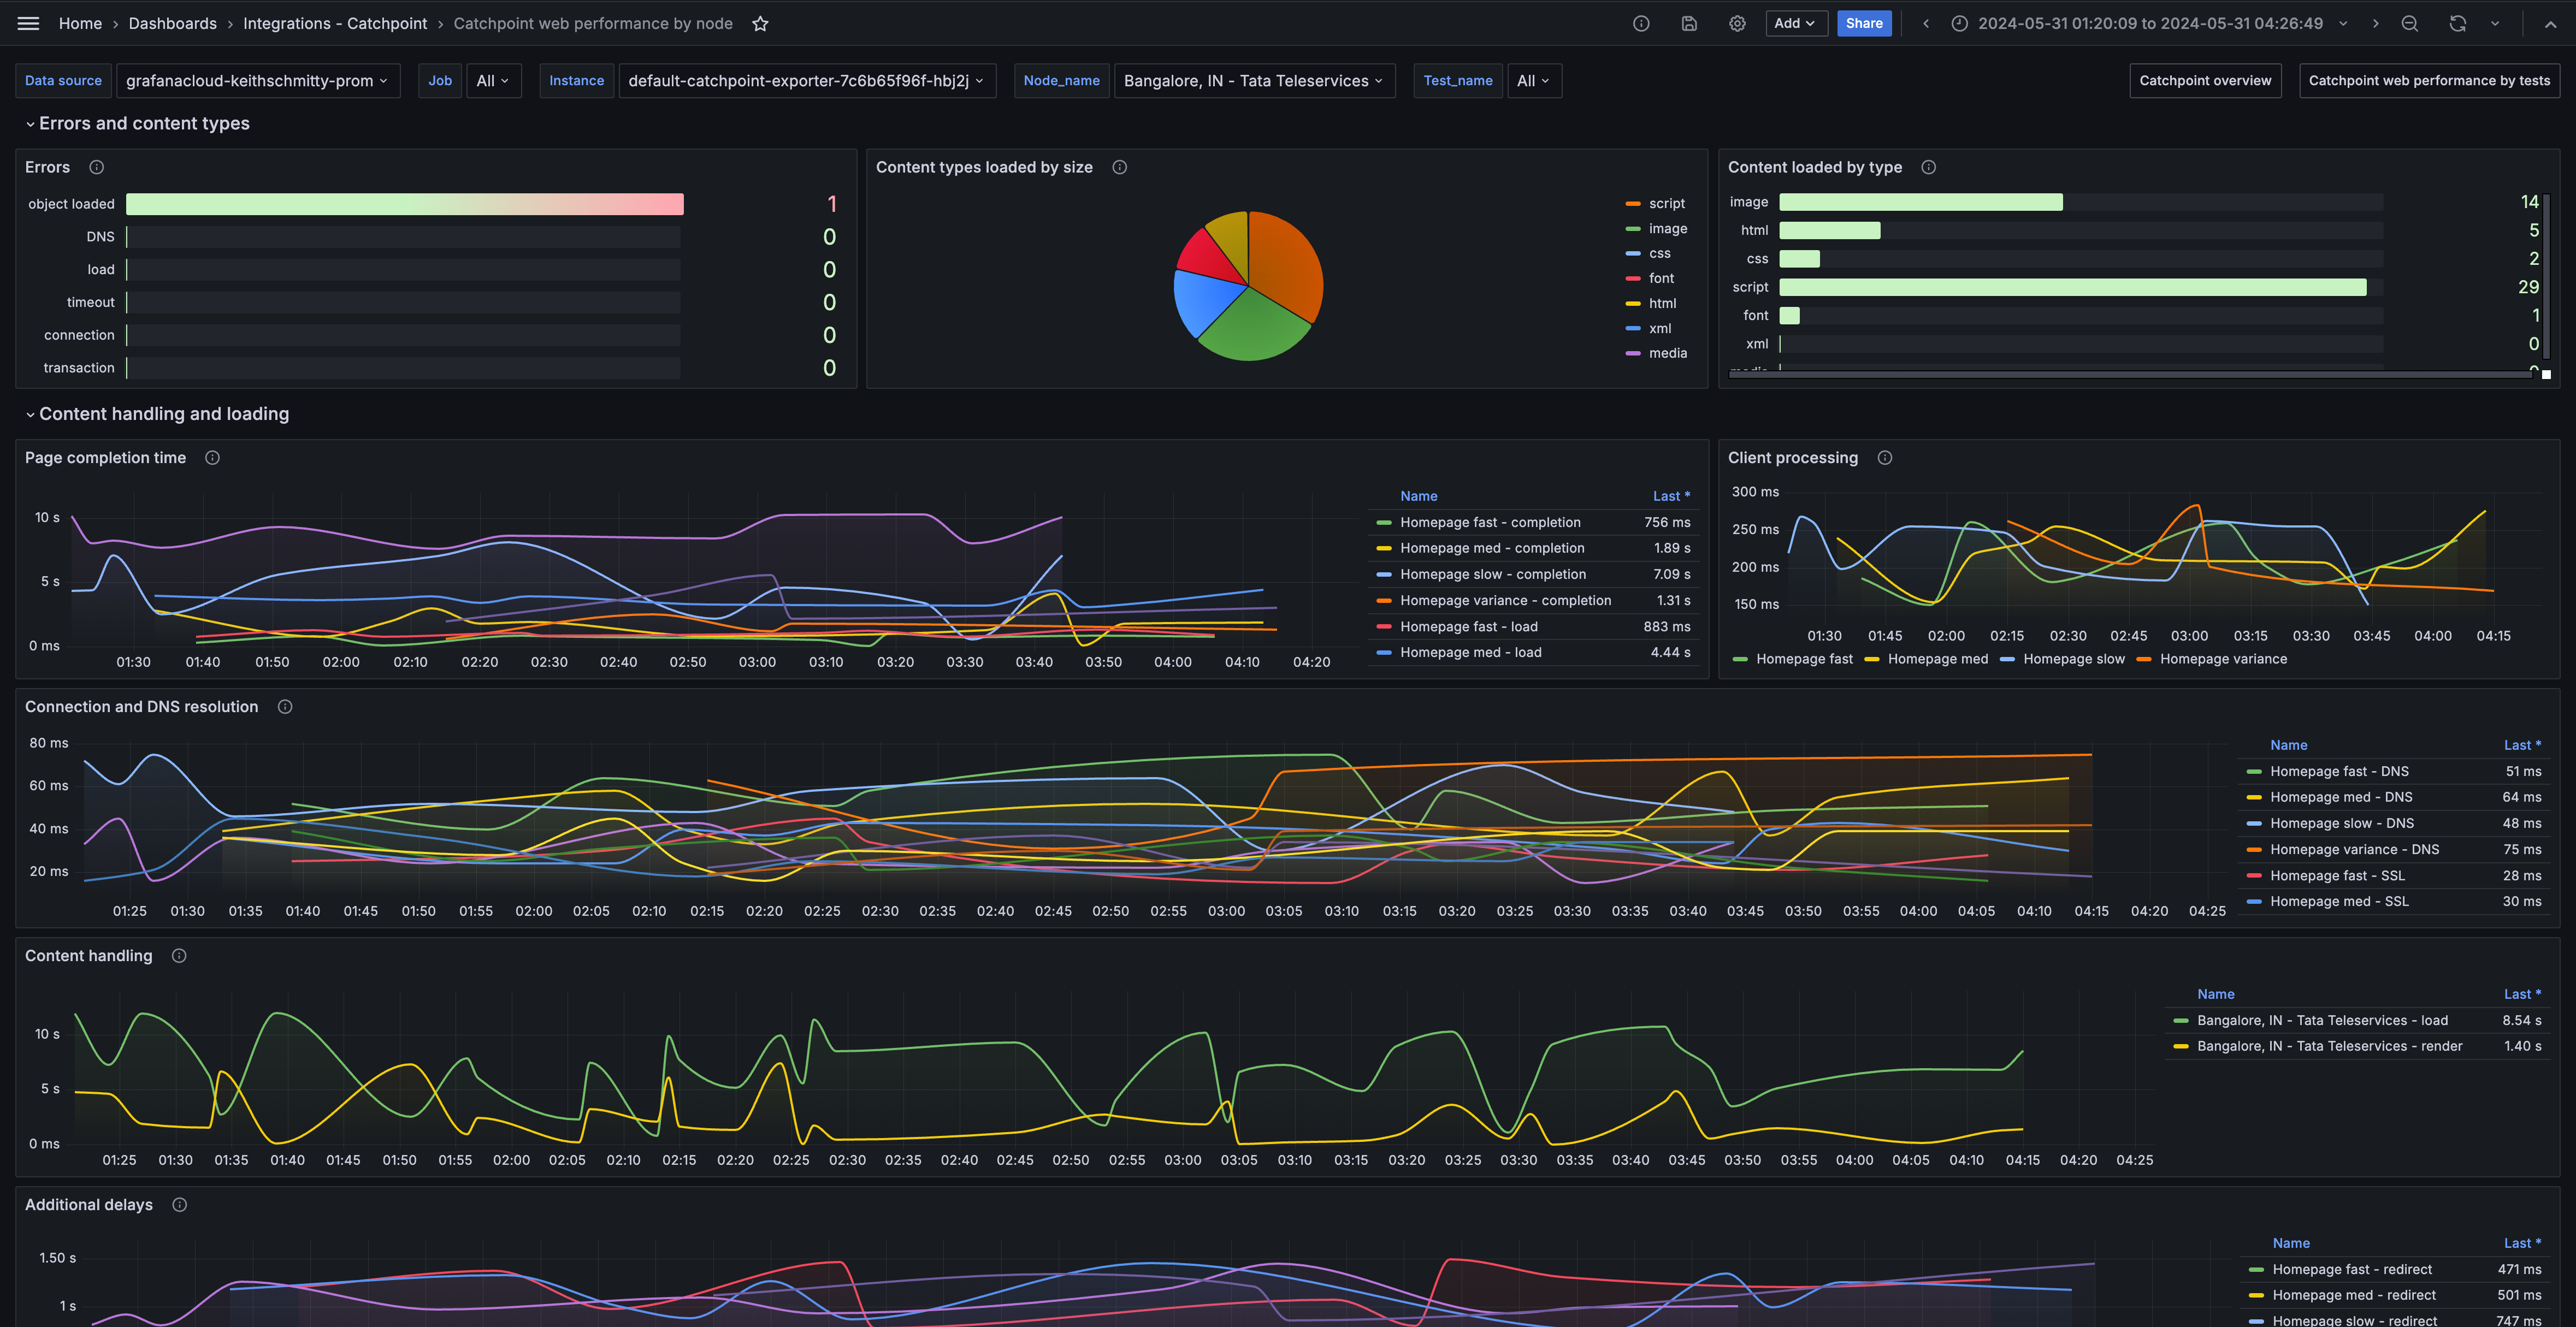
Catchpoint web performance by node
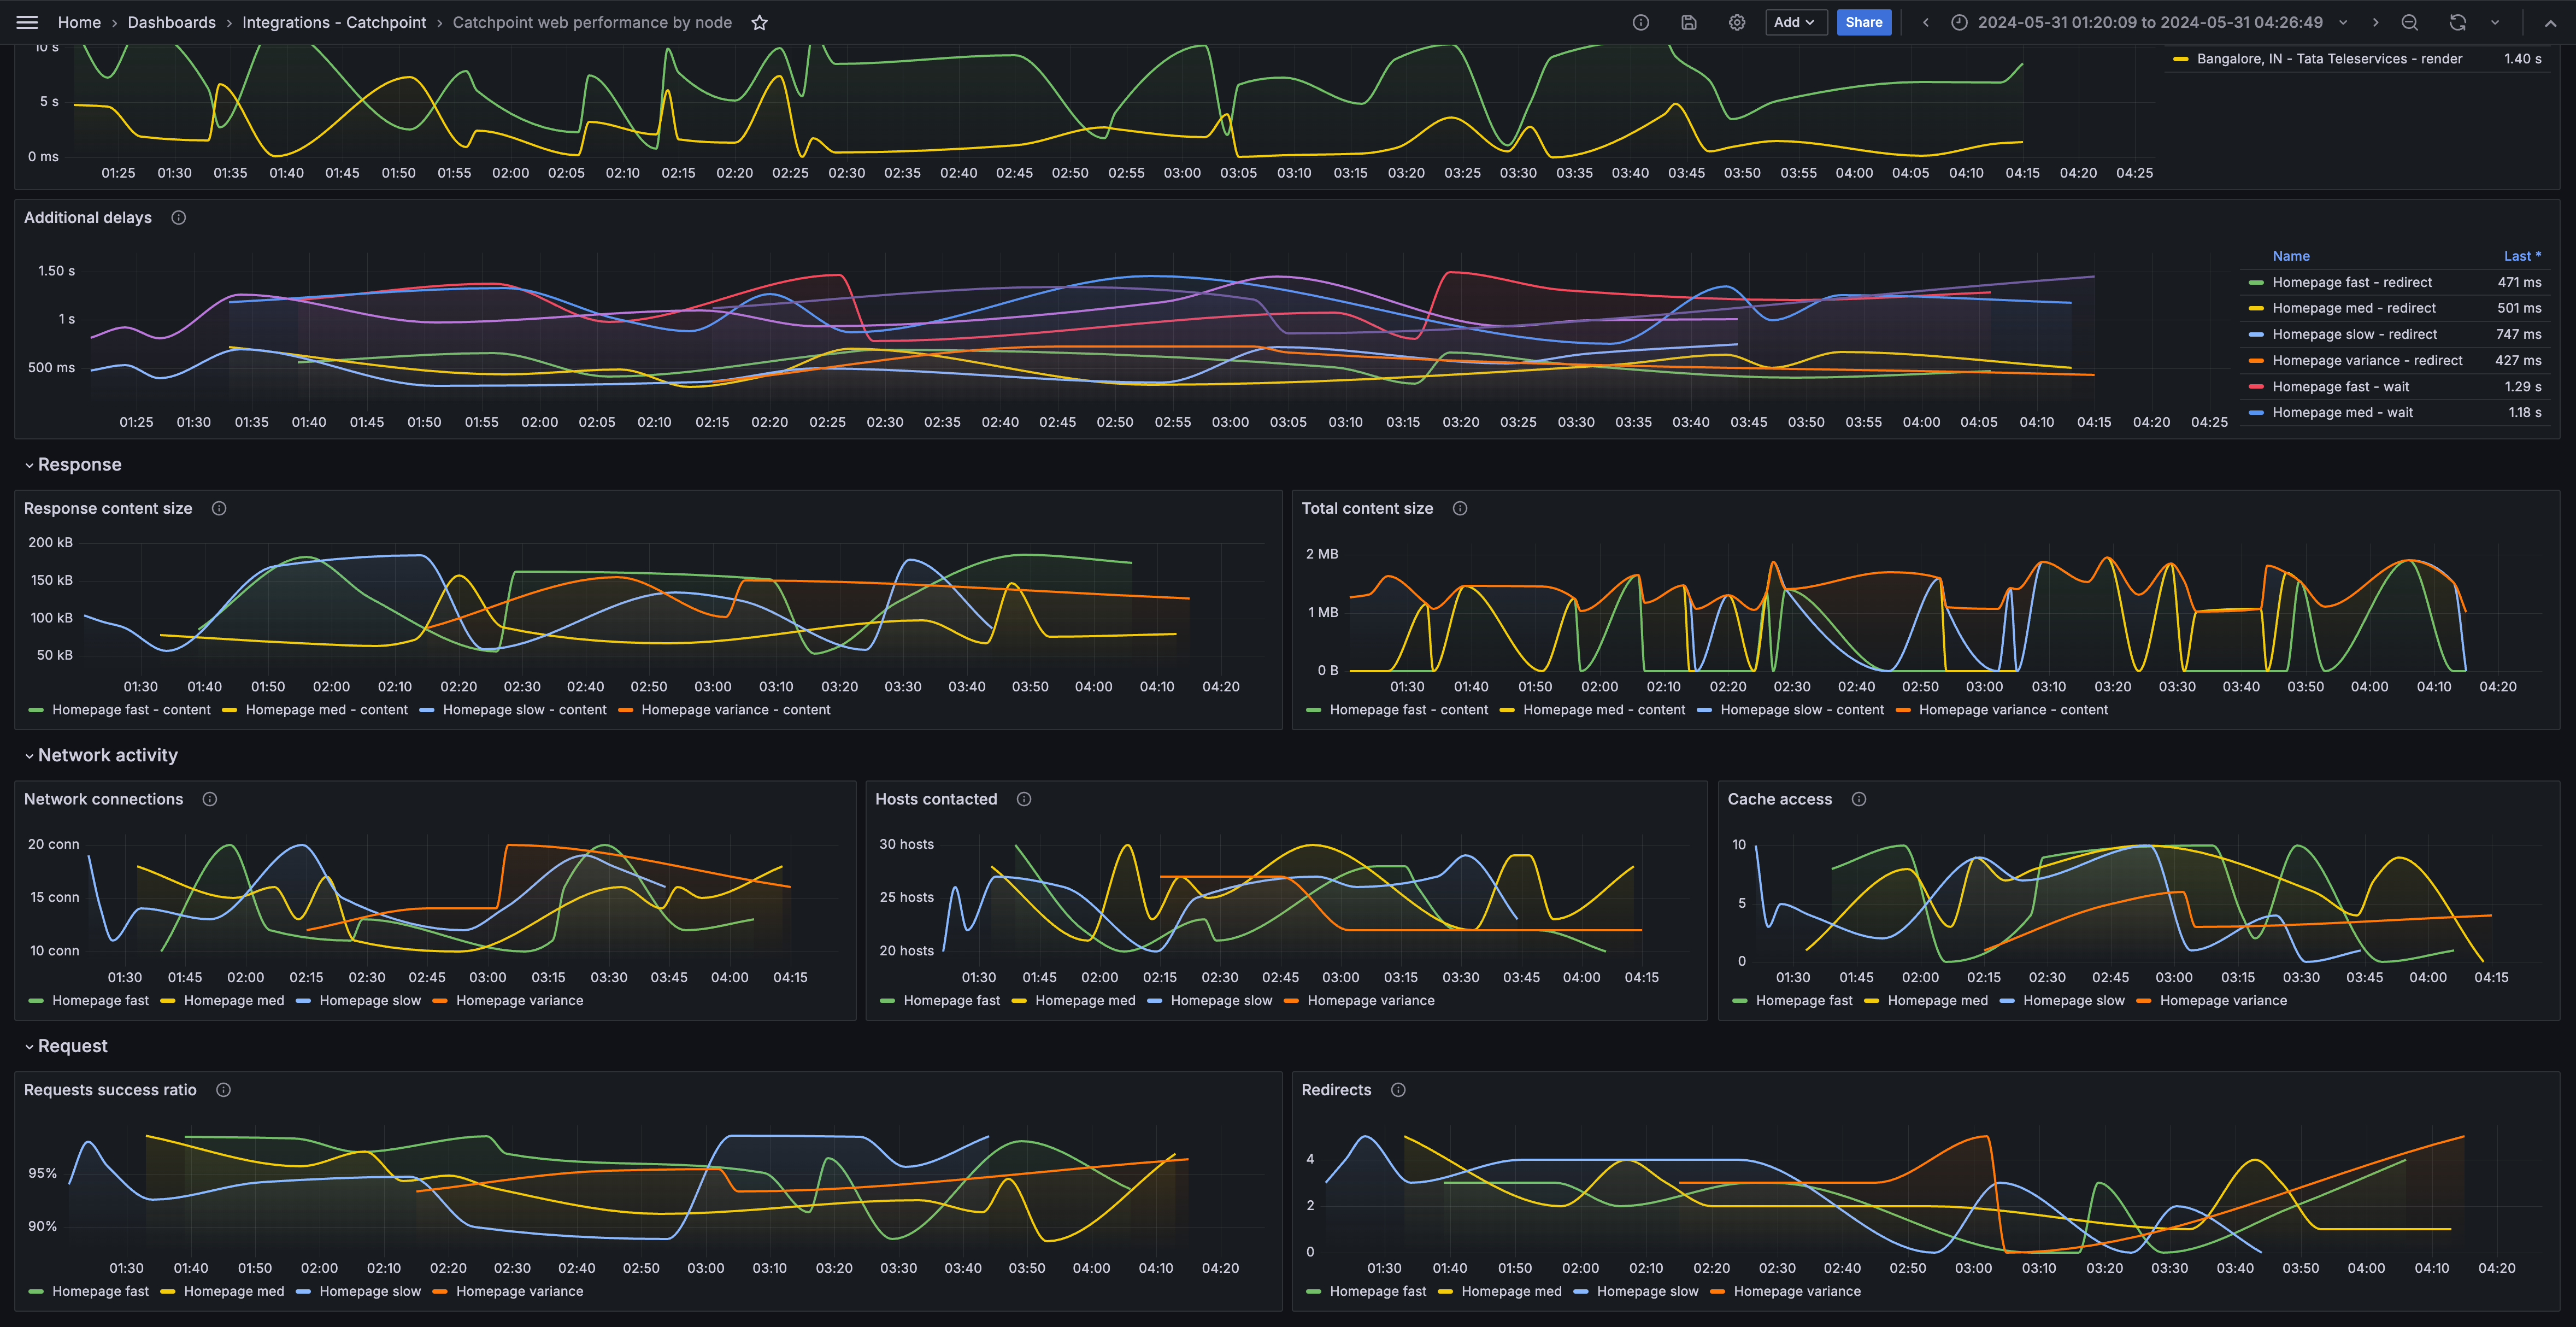
Catchpoint web performance by node (network)