Plugins 〉Leaflet Choropleth


Leaflet Choropleth
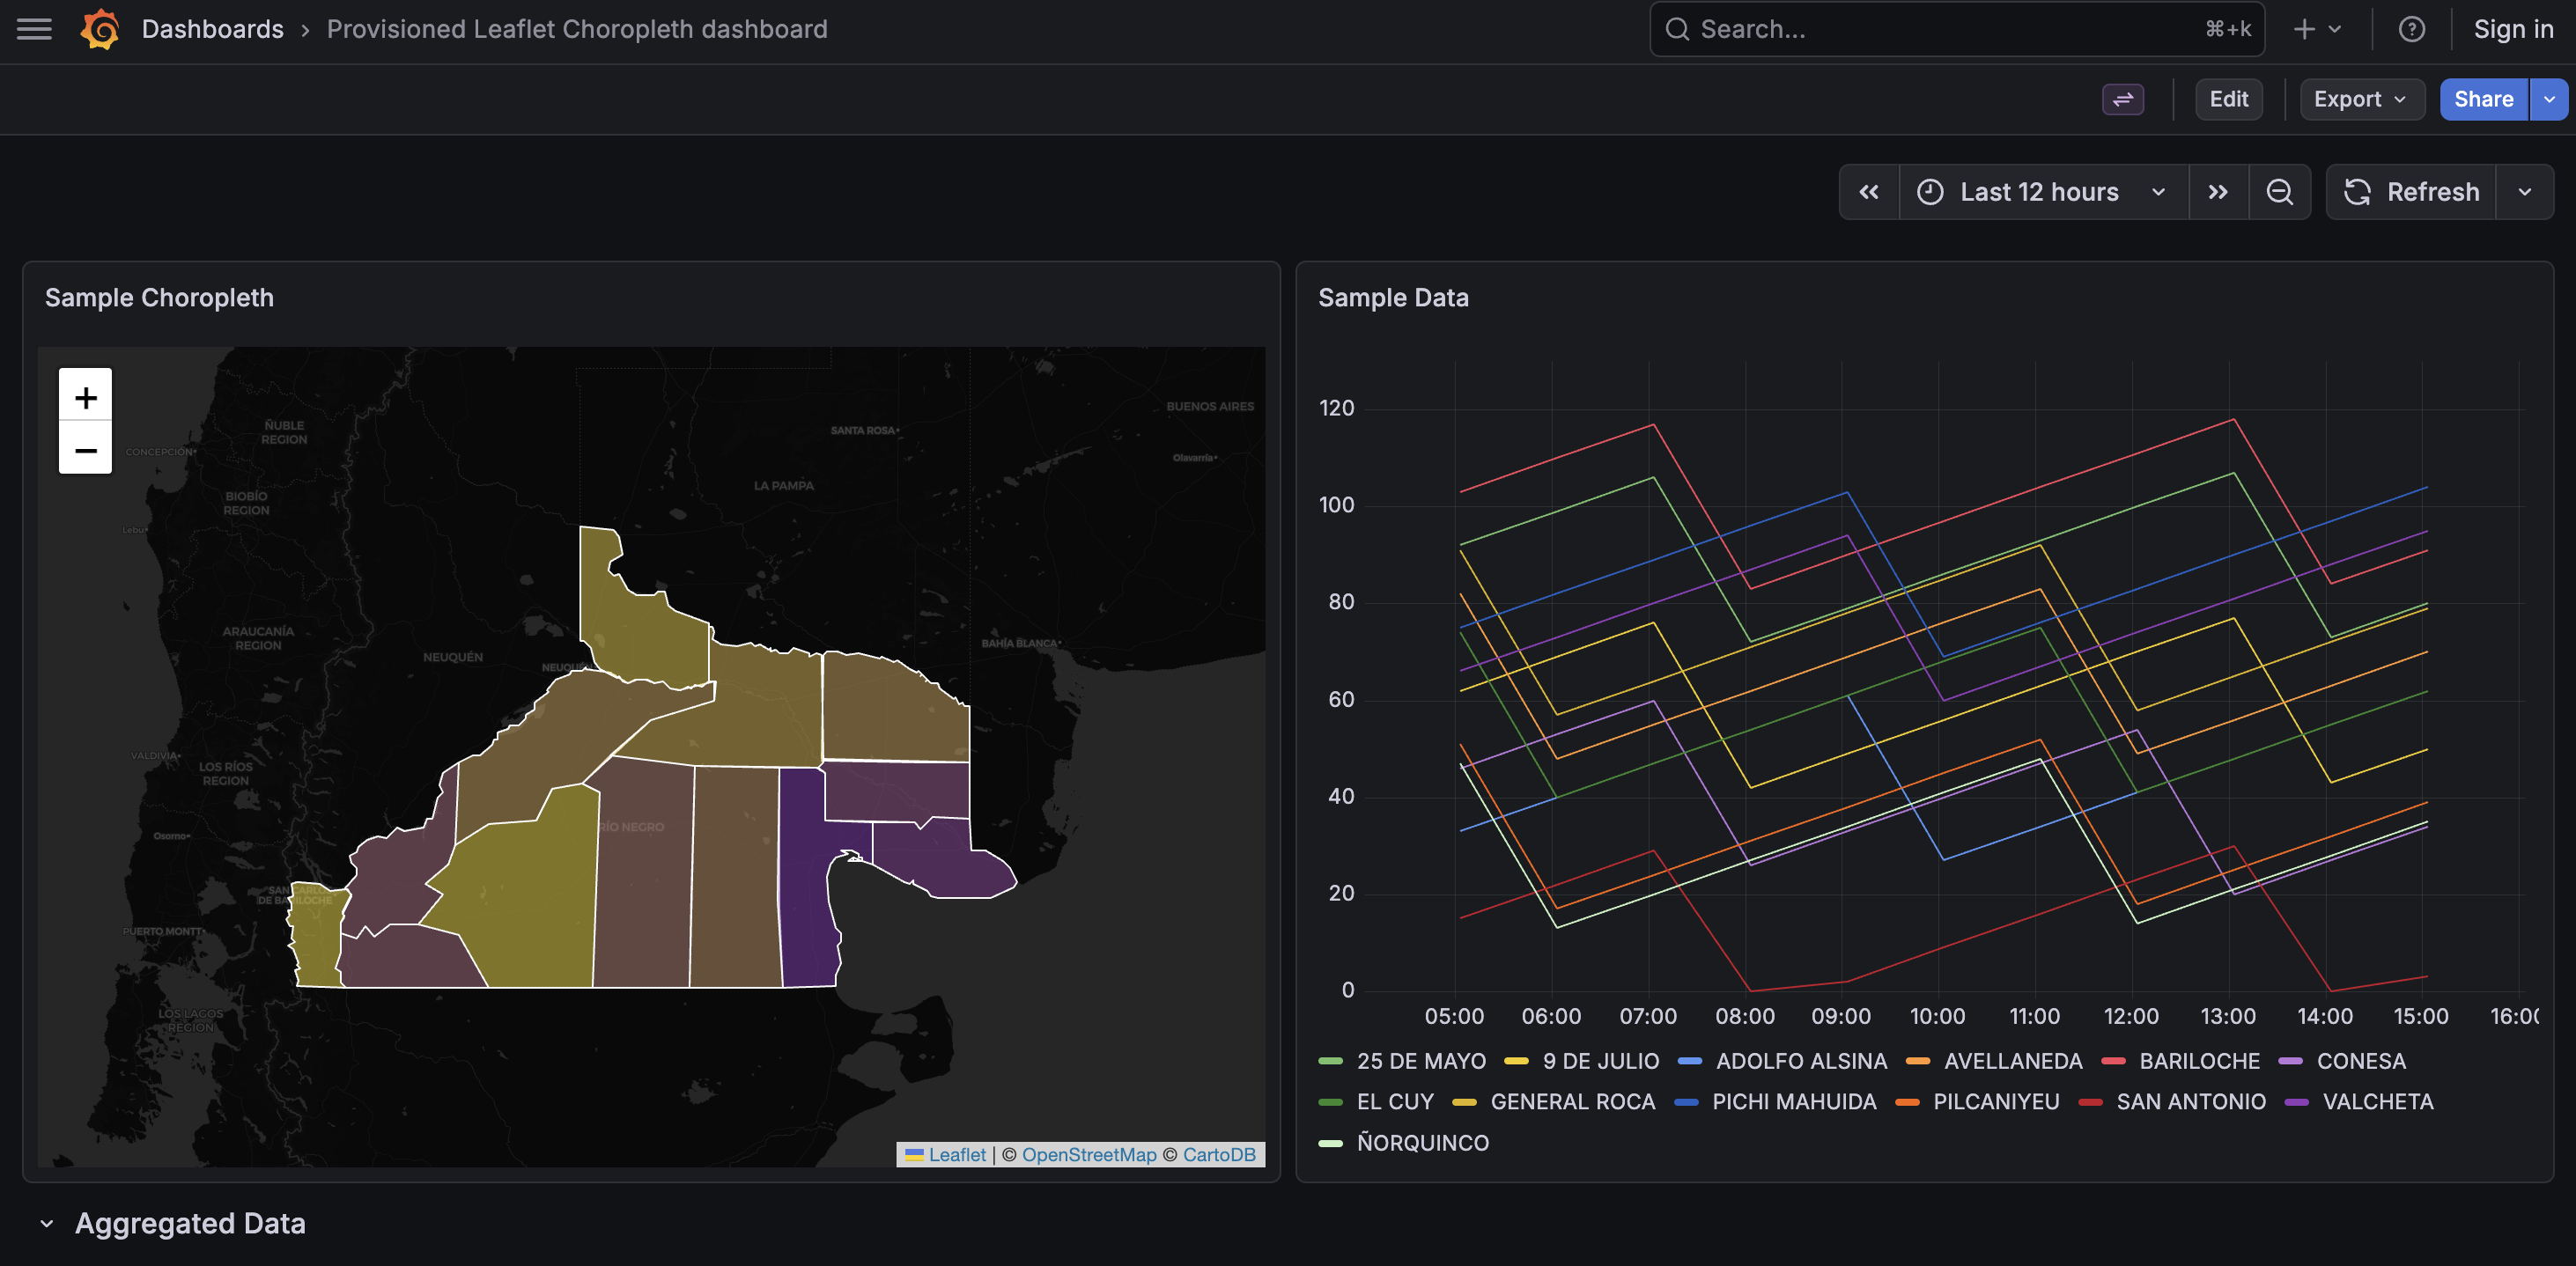
Grafana Leaflet Choropleth Panel
Cross-reference time-series metric data with GeoJSON to display colored polygons on a Leaflet map. A choropleth map shades regions proportionally to a statistical variable, making it easy to visualize how a measurement varies across geographic areas.

Requirements
- Grafana >= 10.0.0
- Node.js >= 22 (see
.nvmrc) - pnpm (declared in
package.jsonpackageManagerfield) - Docker & Docker Compose (for the local dev environment)
Getting started
Terminal 1 — start the webpack dev build in watch mode:
pnpm install
pnpm run dev
Terminal 2 — start the Docker Compose environment:
docker compose up --build
# or: pnpm run server
Then open http://localhost:3000 in your browser. A provisioned dashboard is loaded automatically.
Note: An Ahoy configuration (
.ahoy.yml) is included as an optional convenience wrapper around these commands.
Development environment
docker compose up starts two services:
- Grafana (port 3000) — runs the plugin from the
dist/directory. Anonymous admin access is enabled so no login is required. A livereload script is injected into the Grafana HTML (see.docker/grafana/Dockerfile) so webpack rebuilds trigger automatic browser refresh. - InfluxDB 1.8 (port 8086) — pre-seeded with one year of hourly data via init scripts in
.docker/influxdb/.
A provisioned datasource and dashboard are auto-loaded from .docker/grafana/provisioning/ on startup.
Configuration
These panel options are defined in src/module.ts:
| Option | Description | Default |
|---|---|---|
| GeoJSON Data | Fetch & store GeoJSON for the choropleth layer | — |
| Hot Color | Color for maximum values | #ff0000 |
| Cold Color | Color for minimum values | #0000ff |
| GeoJSON Key | Feature property used to match metric series | — |
| Auto Fit Bounds | Fit map to visible features on data refresh | true |
| Stroke Color | Border color of polygons | #ffffff |
| Stroke Width | Border width of polygons (0–10) | 1 |
| Fill Opacity | Opacity of polygon fill (0–1) | 0.5 |
How it works
The plugin matches Grafana metric series to GeoJSON features using a tag-based naming convention and colors polygons with a chroma-js quantile scale on a Leaflet map with CartoDB dark tiles.
Example: given a series named metric{departamento=CONESA} and GeoJSON Key set to departamento, the plugin finds the GeoJSON feature whose departamento property equals CONESA and assigns it a color. The color is interpolated between the Cold Color (minimum value) and the Hot Color (maximum value) using a chroma-js quantile scale across all matched features.
Available scripts
| Command | Description |
|---|---|
pnpm run dev | Webpack watch mode (development) |
pnpm run build | Production build |
pnpm run server | Start Docker Compose environment |
pnpm run test | Jest in watch mode (changed files only) |
pnpm run test:ci | Jest single run (CI) |
pnpm run typecheck | TypeScript type-check (tsc --noEmit) |
pnpm run lint | ESLint |
pnpm run lint:fix | ESLint auto-fix + Prettier |
Testing
Tests use Jest and React Testing Library.
pnpm run test      # watch mode — re-runs on changes
pnpm run test:ci   # single run (used in CI)
CI
GitHub Actions (.github/workflows/ci.yml) runs on every push and PR to master:
- build — lint, typecheck, and production build (uploads
dist/as artifact) - test — runs
pnpm run test:ci - plugin-check — loads the built plugin into a Grafana container and verifies it is registered via the Grafana API
Project structure
src/
  module.ts              — plugin entry point & panel option definitions
  types.ts               — ChoroplethOptions interface
  components/
    ChoroplethPanel.tsx  — main React panel component + data matching
    ChoroplethMap.ts     — Leaflet map rendering + chroma-js color scale
    GeoJsonEditor.tsx    — panel editor: fetch / preview / clear GeoJSON
    GeoJsonKeyEditor.tsx — panel editor: select feature property key
Grafana Cloud Free
- Free tier: Limited to 3 users
- Paid plans: $55 / user / month above included usage
- Access to all Enterprise Plugins
- Fully managed service (not available to self-manage)
Self-hosted Grafana Enterprise
- Access to all Enterprise plugins
- All Grafana Enterprise features
- Self-manage on your own infrastructure
Install on Grafana Cloud
Plugins can be installed directly from within your Grafana instance or automated using the Cloud API or Terraform.
Learn more about plugin installationMarketplace plugins
This is a paid plugin developed by a marketplace partner. To purchase an entitlement, sign in first, then fill out the contact form.
Get this plugin
This is a paid for plugin developed by a marketplace partner. To purchase entitlement please fill out the contact us form.
What to expect:
- Grafana Labs will reach out to discuss your needs
- Payment will be taken by Grafana Labs
- Once purchased the plugin will be available for you to install (cloud) or a signed version will be provided (on-premise)
Thank you! We will be in touch.
For more information, visit the docs on plugin installation.
Installing on a local Grafana:
For local instances, plugins are installed and updated via a simple CLI command. Plugins are not updated automatically, however you will be notified when updates are available right within your Grafana.
1. Install the Panel
Use the grafana-cli tool to install Leaflet Choropleth from the commandline:
grafana-cli plugins install The plugin will be installed into your grafana plugins directory; the default is /var/lib/grafana/plugins. More information on the cli tool.
Alternatively, you can manually download the .zip file for your architecture below and unpack it into your grafana plugins directory.
Alternatively, you can manually download the .zip file and unpack it into your grafana plugins directory.
2. Add the Panel to a Dashboard
Installed panels are available immediately in the Dashboards section in your Grafana main menu, and can be added like any other core panel in Grafana.
To see a list of installed panels, click the Plugins item in the main menu. Both core panels and installed panels will appear.
Changelog
1.0.0
Breaking Changes
- Complete rewrite from Angular/Grunt/Bower to React/TypeScript/Webpack — Grafana >= 10.0.0 required
Features
- GeoJSON stored in panel options (no runtime fetch) —
10761a7 - GeoJSON Key editor scans features to populate dropdown —
e6f63c1 - Leaflet tooltips on drawn geometries —
f520e9c - Auto Fit Bounds toggle —
34f1e0e - Stroke width, stroke color, fill opacity options —
ac980b8 - Support for Grafana named colors (e.g.
light-blue) —d7e1313
Infrastructure / Dev Environment
- Docker Compose dev environment: Grafana + InfluxDB with seed data —
20021ea,733411c - Livereload injection for automatic browser refresh —
244f2e9 - Grafana provisioning (datasources + dashboard) —
7d7cb8a,612f8d5 - Migrated from npm to pnpm —
6dd3f41 - Migrated Travis CI to GitHub Actions (build + test + plugin-check) —
90fecfe,7b7150f - Release workflow with Grafana plugin validator —
80a5955 - Docker Compose + provisioning + seed data included in release zip
- Screenshot in README with absolute URL for plugin catalog
Internal
- Replaced jQuery AJAX with native fetch API
- Replaced Angular editor template with
setPanelOptionsbuilder - Updated tile URL to current CARTO CDN
- Replaced
leaflet-map-zoomToGeometrieswith nativemap.fitBounds() - Migrated
@grafana/uiSelect to Combobox —f2f2d11 - Consolidated GeoJSON key filtering logic —
c6f52d7 - Test coverage expanded —
b80bf5f