Plugins 〉Tempo


Data Source
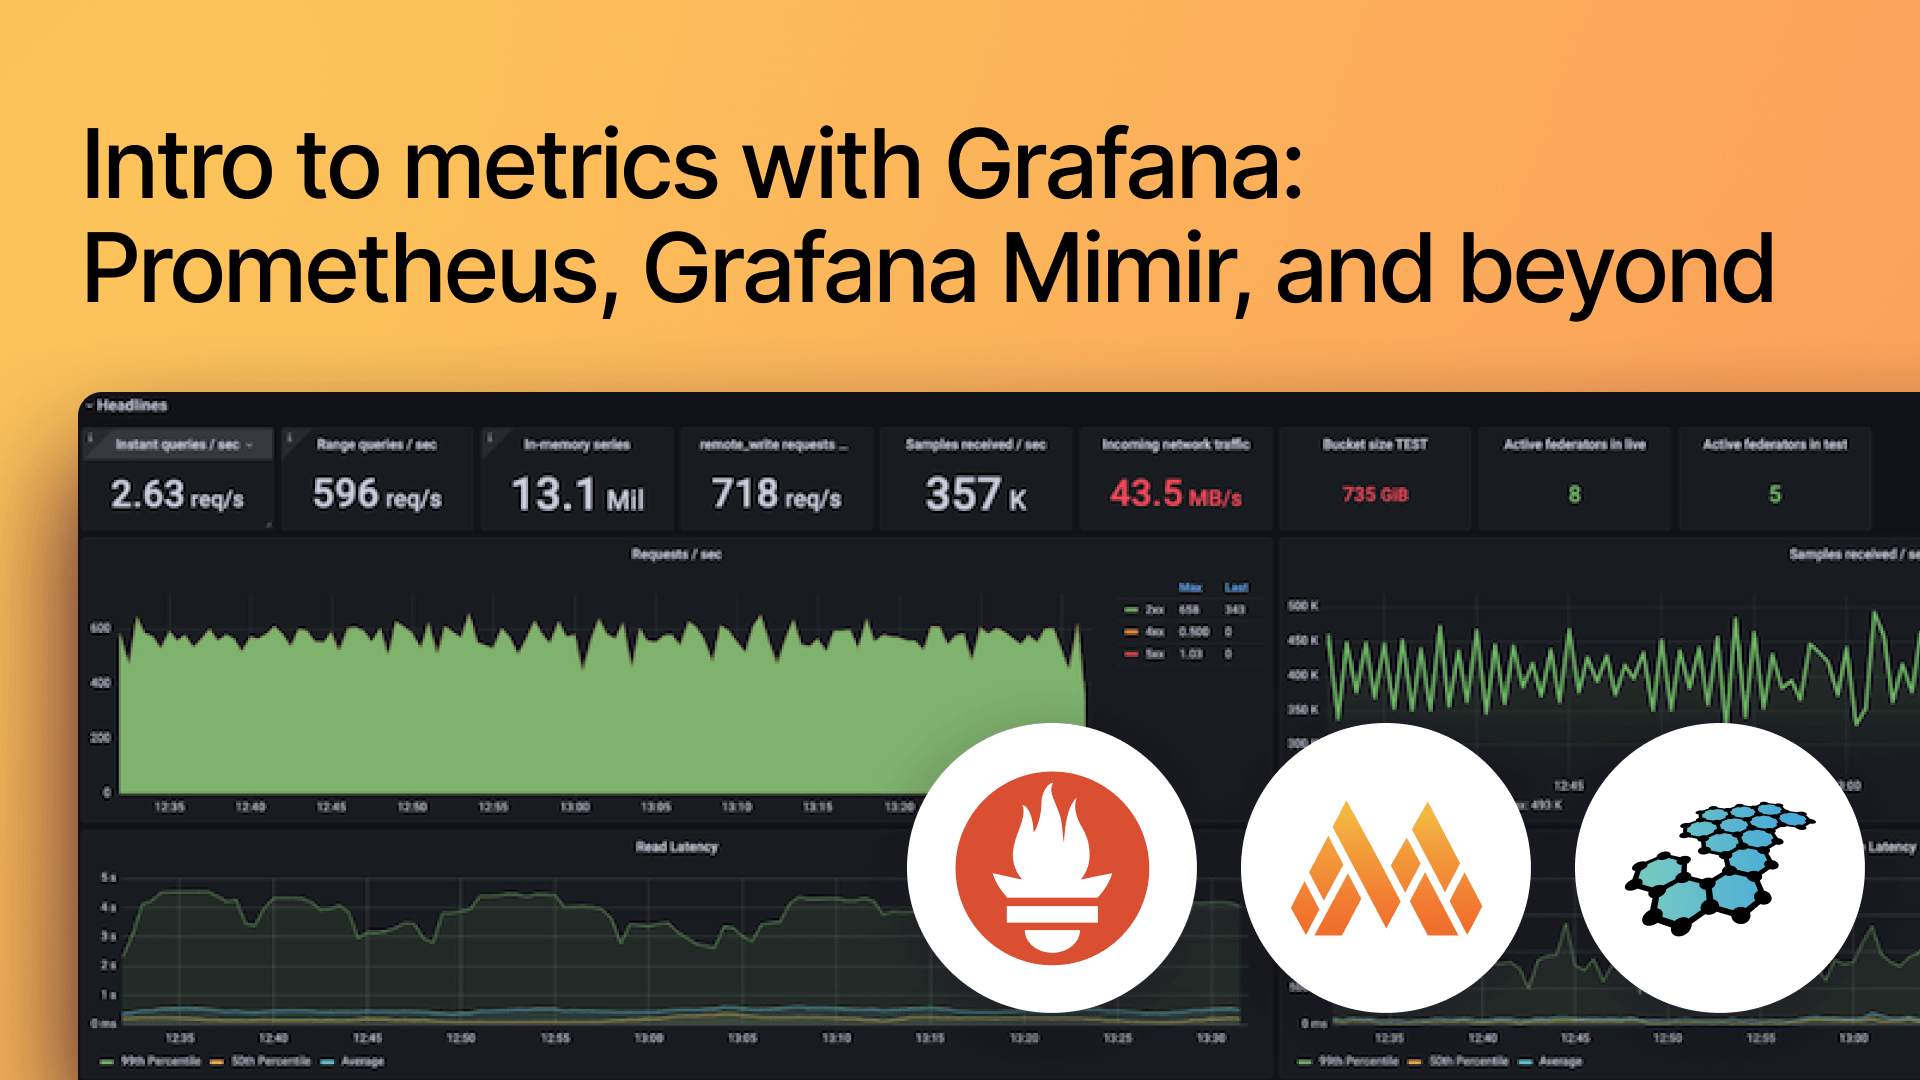
grafana
Marketplace
Tempo
Tempo Data Source - Native Plugin
Grafana ships with built in support for Tempo, an open source, easy-to-use, and high-scale distributed tracing backend.
Read more about it here:
This plugin is included with Grafana and does not require installation. Woo.
Changelog
Docs
Additional settings
Docs
Configure trace correlation using Terraform
Docs
Configure trace to logs correlation
Docs
Configure trace to metrics correlation
Docs
Configure trace to profiles correlation
Docs
Provision the Tempo data source
Docs
Search traces using the query builder
Docs
Service Graph and Service Graph view
Docs
Span filters
Docs
Trace correlations
Docs
TraceQL query examples
Docs
Troubleshoot Tempo data source issues
Docs
Write TraceQL queries with the editor
Blog
Grafana Tempo 1.5 release: New metrics features with OpenTelemetry, Parquet support, and the path to 2.0
Blog
New in Grafana 9.1: Trace to metrics allows users to navigate from a trace span to a selected data source