Plugins 〉TDengine Datasource


TDengine Datasource

Grafana Plugin for TDengine
TDengine is open-sourced big data platform under GNU AGPL v3.0, designed and optimized for the Internet of Things (IoT), Connected Cars, Industrial IoT, and IT Infrastructure and Application Monitoring, developed by TDengine.
TDengine data source plugin is developed for Grafana. This document explains how to install and configure the data source plugin, and use it as a time-series database. We'll take a look at the data source options, variables, querying, and other options specific to this data source.
At first, please refer to Add a data source for instructions on how to add a data source to Grafana. Note that, only users with the organization admin role can add data sources.
To install this plugin, please refer to Install the Grafana Plugin for TDengine
Usage
Now it's ready for you to add your own TDengine data source and use it in a dashboard. Refer to Grafana Datasource documentations topic - Add a data source for a quick view. Please make sure the TDengine backend daemon taosd and TDengine RESTful service backend daemon taosadapter already launched.
Add Data Source
Point to Configurations -> Data Sources menu and then Add data source button.

Search and choose TDengine.

If TDengine is not in the list, please check the installation instructions for allowing loading unsigned plugins.
Configure TDengine data source for Grafana version 11.
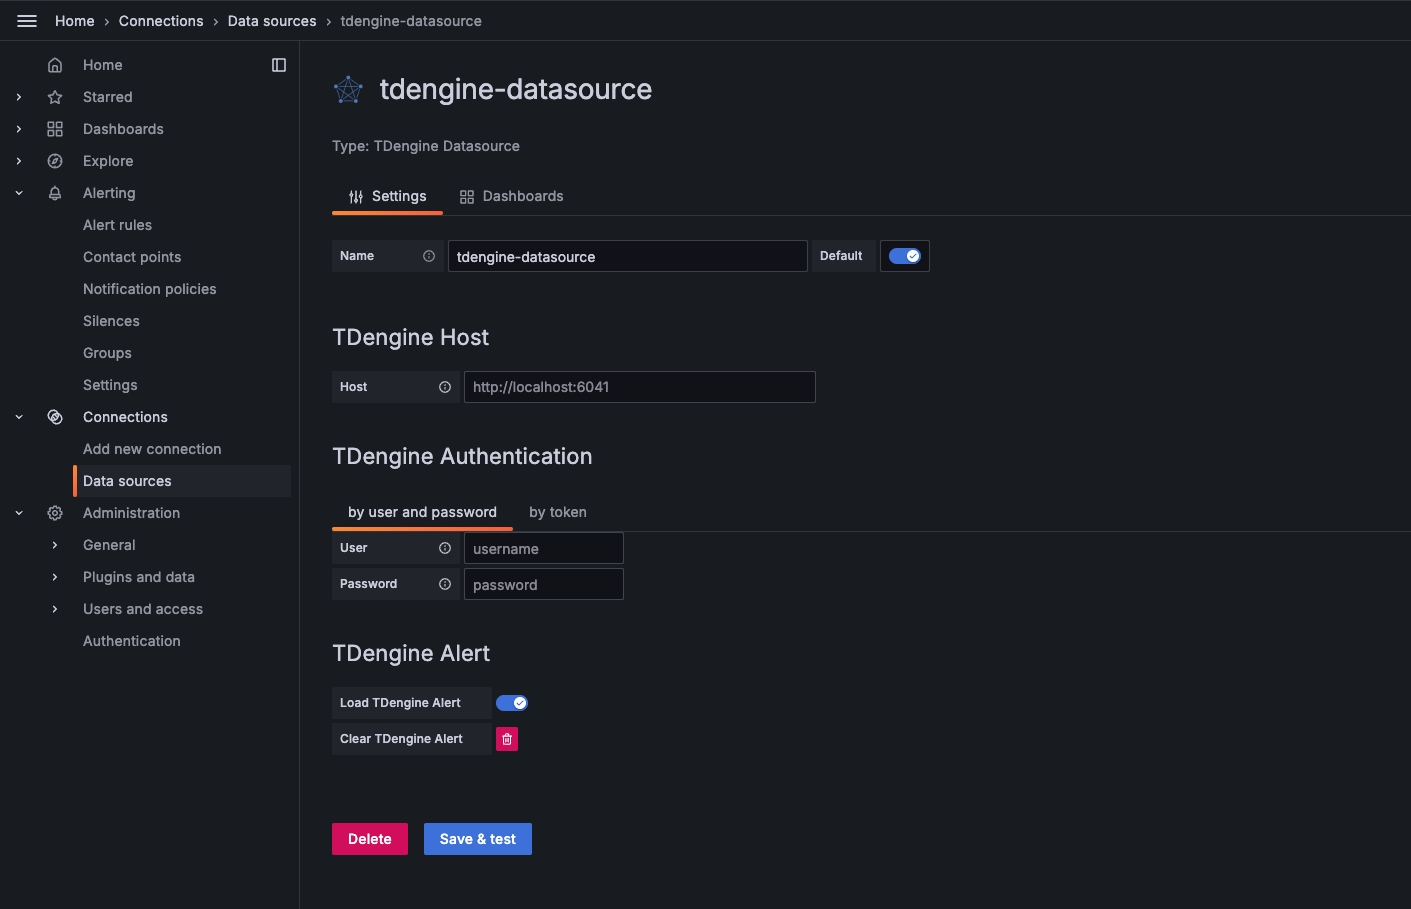 Note:
Note:
- Close the Load TDengine Alert button to prevent automatic import of alert rules when adding data sources.
- When deleting a data source, it is necessary to first clear the imported alert rules
Configure TDengine data source for Grafana with version lower than 11.

Save and test it, it should say 'TDengine Data source is working'.

Import Dashboard
Point to + / Create - import (or /assets/import url).

Now you can import dashboard with JSON file or grafana dashboard id (please make sure your network is public to https://grafana.com).
Here is the first grafana dashboard you want to use for TDengine, the grafana dashboard id is 18180.

After import:

Important changes
v3.6.0
Grafana 11 versions
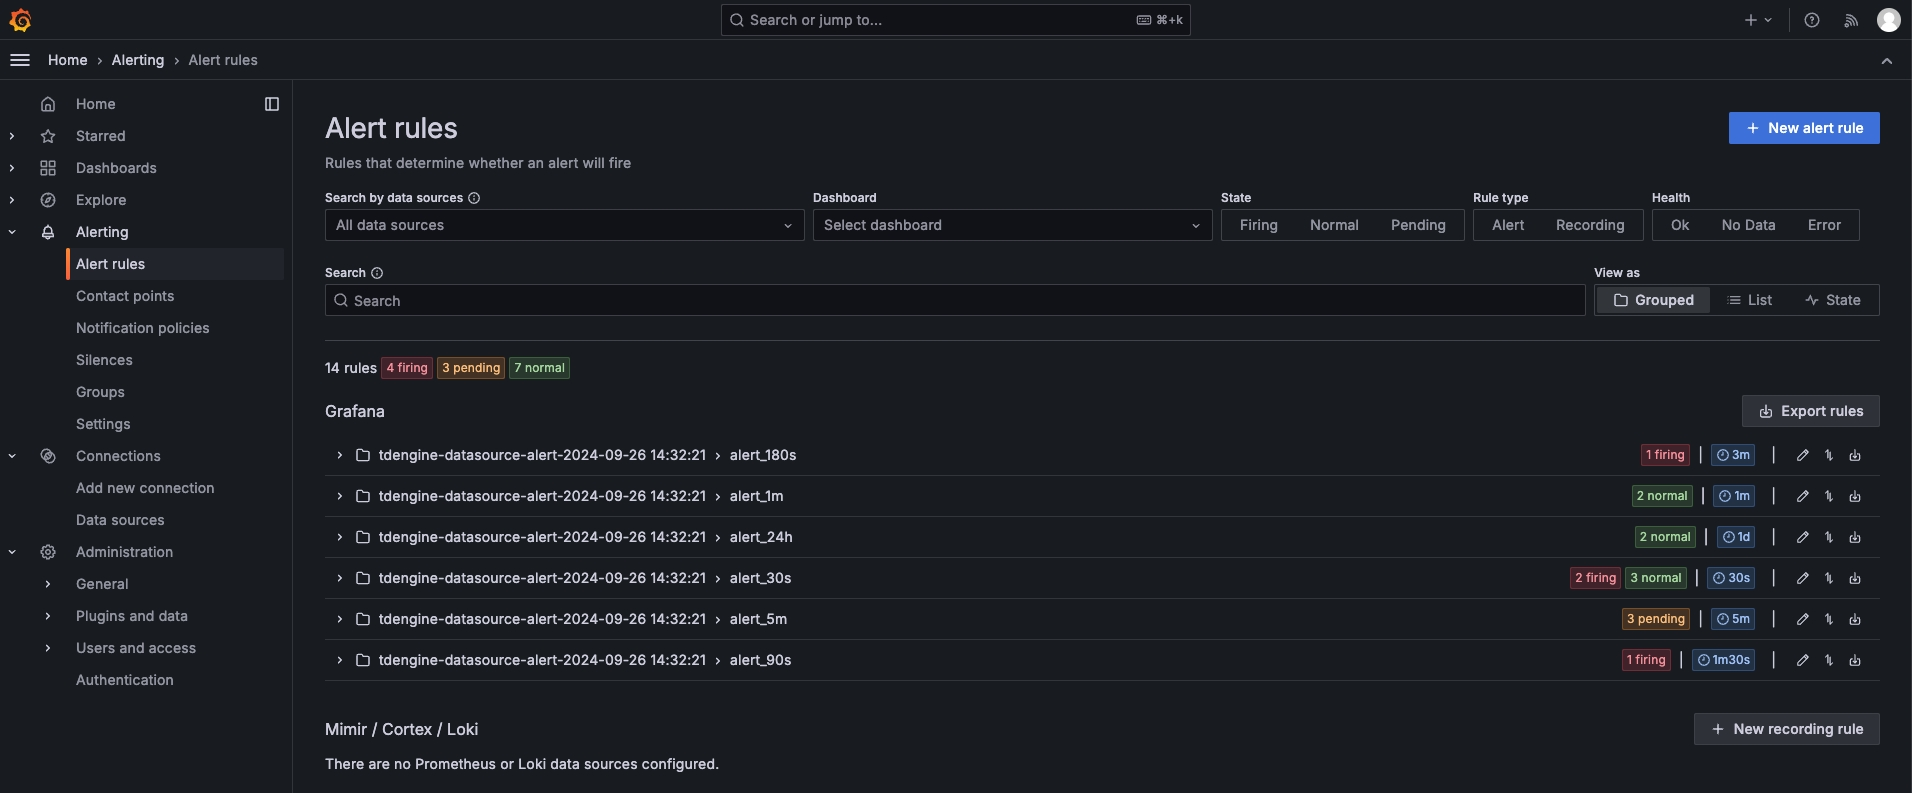
The TDengine data source plugin has added functionality for Grafana 11 versions, which can automatically import and clear alerts for basic metrics of the TDengine cluster (such as CPU, memory, dnode, vnode, etc.) when adding data sources.
Note:(1)Close the Load TDengine Alert button to prevent automatic import of alert rules when adding data sources.
(2)When deleting a data source, it is necessary to first clear the imported alarm rules.
After adding the data source, you will see the automatically imported alert configuration in the alert management menu.
Grafana 7.5 versions
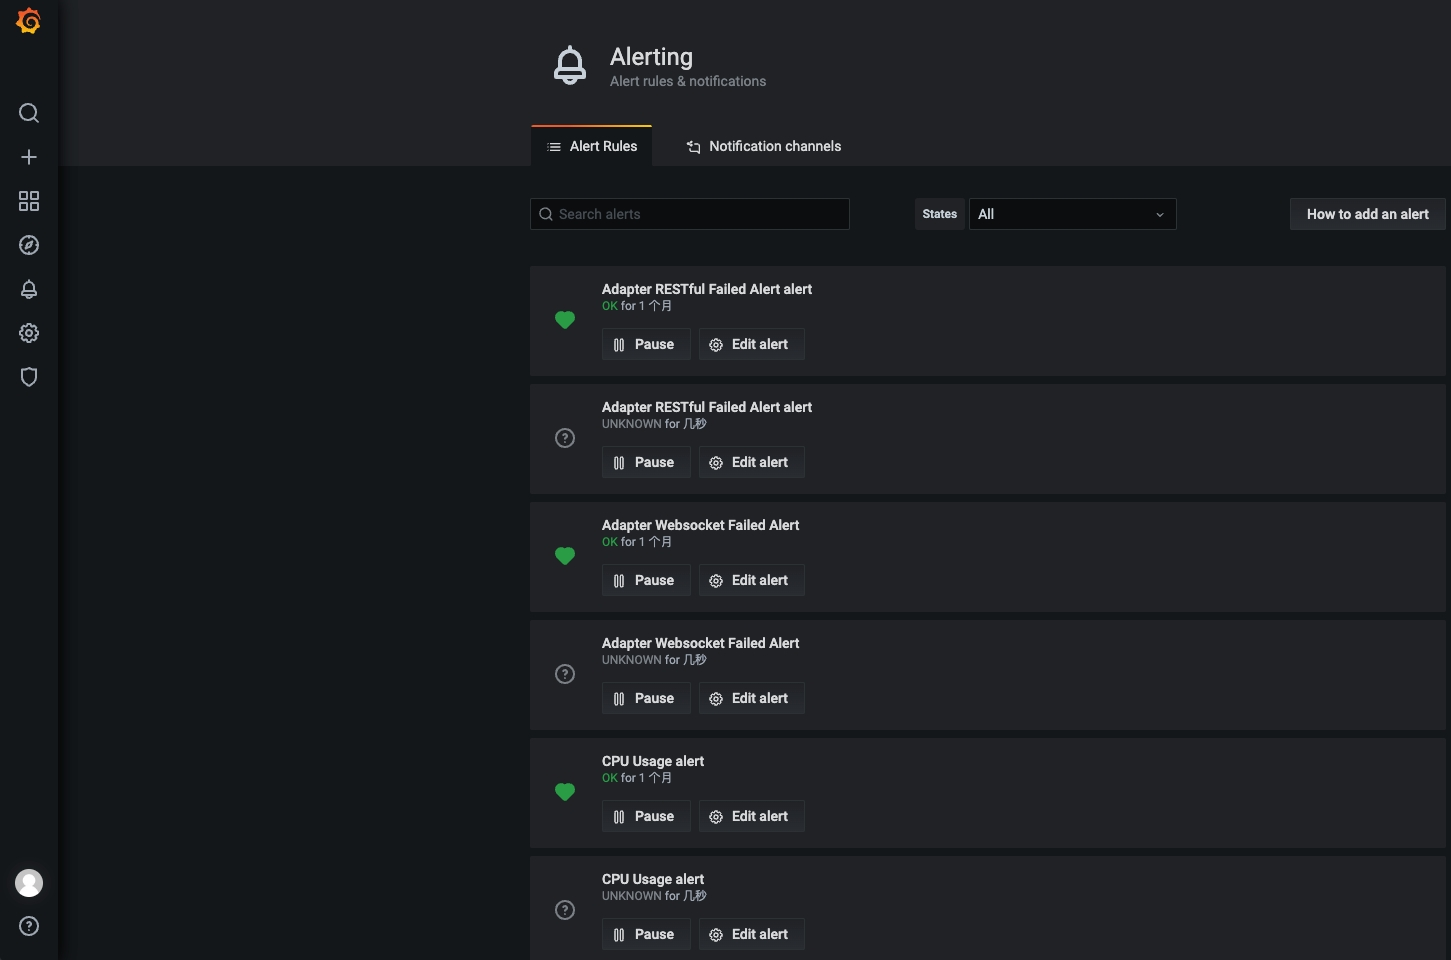
The TDengine data source plugin has added functionality for Grafana 7.5 versions, which can automatically import and clear alerts for basic metrics of the TDengine cluster (such as CPU, memory, dnode, vnode, etc.) when adding data sources.
To import the Dashboard, enter "TDinsight for 3.x Dashboard" and click save. Subsequently, the loaded alert rules will appear in the alert menu as shown below.
v3.2.0
TDengine data source plugin uses secureJsonData to store sensitive data. It will cause a breaking change when you're upgrading from an older version:
The simple way to migrate from older version is to reconfigure the data source like adding a data source from scratch.
If you're using Grafana provisioning configurations, you should change the data source provisioning configuration file to use
secureJsonData:apiVersion: 1 datasources: # <string, required> name of the datasource. Required - name: TDengine # <string, required> datasource type. Required type: tdengine-datasource # <string, required> access mode. direct or proxy. Required # <int> org id. will default to orgId 1 if not specified orgId: 1<string> url to TDengine rest api, eg. http://td1:6041
url: “$TDENGINE_API”
<bool> mark as default datasource. Max one per org
isDefault: true
<map>
secureJsonData: # <string> a redundant url configuration. Required. url: “$TDENGINE_API” # <string> basic authorization token. Required, can be build like #
printf root:taosdata|base64basicAuth: “${TDENGINE_BASIC_AUTH}” # <string> cloud service token of TDengine, optional. token: “$TDENGINE_CLOUD_TOKEN”version: 1
<bool> allow users to edit datasources from the UI.
editable: true
Now users can quickly import TDinsight dashboard in Dashboards tab in a datasource configuration page.

Monitor TDengine Database with TDengine Data Source Plugin
See How to Monitor TDengine Cluster with Grafana for the details.
TDinsight
TDinsight is a simple monitoring solution for TDengine database. See TDinsight README for the details.
Docker Stack
For a quick look and test, you can use docker-compose to start a full Grafana + AlertManager + Alert Webhook stack:
docker-compose up -d
Services:
- Grafana: http://localhost:3000
- AlertManager: http://localhost:9093, in docker it's http://alertmanager:9010/sms
- Webhook: http://localhost:9010/sms, in docker it's http://webhook:9010/sms
Dashboards
You can get other dashboards in the examples' directory, or search in grafana with TDengine datasource https://grafana.com/grafana/dashboards/?orderBy=downloads&direction=desc&dataSource=tdengine-datasource .
Here is a short list:
You could open a pr to add one if you want to share your dashboard with TDengine community, we appreciate your contribution!
Grafana Cloud Free
- Free tier: Limited to 3 users
- Paid plans: $55 / user / month above included usage
- Access to all Enterprise Plugins
- Fully managed service (not available to self-manage)
Self-hosted Grafana Enterprise
- Access to all Enterprise plugins
- All Grafana Enterprise features
- Self-manage on your own infrastructure
Install on Grafana Cloud
Plugins can be installed directly from within your Grafana instance or automated using the Cloud API or Terraform.
Learn more about plugin installationMarketplace plugins
This is a paid plugin developed by a marketplace partner. To purchase an entitlement, sign in first, then fill out the contact form.
Get this plugin
This is a paid for plugin developed by a marketplace partner. To purchase entitlement please fill out the contact us form.
What to expect:
- Grafana Labs will reach out to discuss your needs
- Payment will be taken by Grafana Labs
- Once purchased the plugin will be available for you to install (cloud) or a signed version will be provided (on-premise)
Thank you! We will be in touch.
For more information, visit the docs on plugin installation.
Installing on a local Grafana:
For local instances, plugins are installed and updated via a simple CLI command. Plugins are not updated automatically, however you will be notified when updates are available right within your Grafana.
1. Install the Data Source
Use the grafana-cli tool to install TDengine Datasource from the commandline:
grafana-cli plugins install The plugin will be installed into your grafana plugins directory; the default is /var/lib/grafana/plugins. More information on the cli tool.
Alternatively, you can manually download the .zip file for your architecture below and unpack it into your grafana plugins directory.
Alternatively, you can manually download the .zip file and unpack it into your grafana plugins directory.
2. Configure the Data Source
Accessed from the Grafana main menu, newly installed data sources can be added immediately within the Data Sources section.
Next, click the Add data source button in the upper right. The data source will be available for selection in the Type select box.
To see a list of installed data sources, click the Plugins item in the main menu. Both core data sources and installed data sources will appear.
Changelog
All notable changes to this project will be documented in this file.
[3.7.1] - 2025-02-10
Features
- Supports multi-line SQL editor.
- Added the 'Classified Connection Counts' table to the TDinsightV3 dashboard.
[3.7.0] - 2024-11-20
Features
- migrate TDengine Grafana plugin from Angular to React
[3.6.3] - 2024-11-05
Bug Fixes
- fix TDinsight Request data issue.
[3.6.2] - 2024-10-29
Features
- improve alert ui.
[3.6.1] - 2024-10-11
Features
- improve alert ui.
[3.6.0] - 2024-09-28
Features
- support taosd alert configuration for grafana 11 and 7.5 version.
[3.5.2] - 2024-06-25
Features
- update taosd dashboard.
[3.5.1] - 2024-04-30
Bug Fixes
Features
- update taosX and taosd dashboard.
[3.5.0] - 2024-03-05
Bug Fixes
Features
- add TDinsight for taosX dashboard.
- new TDinsight for 3.x dashboard.
[3.4.7] - 2024-01-27
Bug Fixes
Features
- remove TDpower dashboard.
[3.4.6] - 2024-01-02
Bug Fixes
fix slow sqls fix sql bug remove console log
[3.4.3] - 2023-12-22
Bug Fixes
fix problem with the token field
update some outdated pictures
[3.4.2] - 2023-12-13
Bug Fixes
fix token input bug
Features
modify TDinsight to TDinsight 2.x
[3.4.1] - 2023-11-14
Bug Fixes
Features
- New dashboards: TDpower and TDsmeters.
[3.4.0] - 2023-10-31
Bug Fixes
Features
- New Taosadapter dashboard
- Add datasource for adapter dashboard
- Change legend for adapter dashboard
[3.3.6] - 2023-10-14
Bug Fixes
- Fix sql in telgraf dashboard
Enhancements
- Change datasource config page
[3.3.5] - 2023-09-22
Bug Fixes
- Fix for time shift
- Fix request url
- Fix unit in tdinsight v3
- Fix for datasource routing
- Fix display of host and user when save clicked
Build
- Bump @adobe/css-tools from 4.1.0 to 4.3.1 (#224)
[3.3.4] - 2023-07-25
Bug Fixes
- Fix for http status code dashboard
Enhancements
- Check tdengine api schema in tdinsight.sh
- Delete login history dashboard
Build
- Bump word-wrap from 1.2.3 to 1.2.4 (#218)
[3.3.3] - 2023-07-12
Bug Fixes
- Fix for http status code
- Fix for taoskeeper prometheus dashboard v3
- Fix for tdinsight v3 and prometheus v3 dashboard
Documentation
- Update tdinsight document
Enhancements
- Add default value to database and delete
user db
Features
- Add taoskeeper prometheus dashboard (#209)
Build
- Bump google.golang.org/grpc from 1.41.0 to 1.53.0 (#213)
- Bump semver from 5.7.1 to 5.7.2 (#214)
[3.3.2] - 2023-04-13
Bug Fixes
- Remove group by
- Adapt keepColName params
- Set datasource for http status code dashboard (#200)
- Fix for total tables (#201)
- Fix for table summary
- Fix for table data type
- Fix for duplicate metric name
Enhancements
- Support variables query key/value
Build
- Bump webpack from 5.75.0 to 5.76.0 (#195)
[3.3.1] - 2023-03-15
Bug Fixes
- Typos
- Typos
- Fix for telegraf dashboard (#187)
- Fix for unused formatType config
- Delete console log in datasource.ts (#191)
- Refactor readme and upgrade dependence and fix tdinsight v3
- Typos
- Fix for log (#194)
Documentation
- Add readme for tdinsight v3
[3.3.0] - 2023-02-24
Bug Fixes
- Revert
testDatasourcefunction - Change httpclient and delete sensitive log
- Delete token from log (#184)
Enhancements
- Refactor by grafana/create-plugin (#179)
Build
- Fix release workflow for missing module.js.map
- Fix release work flow
[3.2.9] - 2023-02-08
Bug Fixes
- Tdinsight v3.x support grafana 7.x (#170)
- Fix http request dashboard
- Fix block while format column name
- Add error message when query data error
Enhancements
- Support multi dimension alert
- Add http_status_code dashboard (#173)
Features
- Support set legend alias by setting format-str
Build
- Add license to dist
[3.2.8] - 2022-12-29
Bug Fixes
- Delete frame name, otherwise this name will override data column name
- Tdinsight dashboard show error
[3.2.7] - 2022-11-15
Bug Fixes
- Fix TDinsight.sh --offline error (#152)
- Change time unit and placement of charts (#153)
- Telegraf conf refine (#154)
- Fix page fault for TDinsight v3 in grafana (#161)
Documentation
- Add install plugin from config section (#157)
- Readme add bullet link (#158)
- Wording align with official doc (#159)
- Fix a few typos and wording
Enhancements
- Grafana plugin support TDengine 3.0 (#162)
[3.2.6] - 2022-08-12
Bug Fixes
- Install.sh -p not work
- Fix offline plugin not found error (#146)
- Compatible with python2 (#148)
- Modify taosAdapter http_request_total dashboard
- Add error reason
- Add V3 dashboard
- Timestamp code
CI
- Fix ci syntax error
Documentation
- Update README for data source name settings
Enhancements
- Do not cache zip file when there's no python in system (#138)
- Anyone can request a release by pr
- Match 3.0 (#149)
[3.2.5] - 2022-06-10
Bug Fixes
- Auto detect sudo command in installer (#135)
- Fix --plugin-version bug and support cloud token like install.sh (#136)
Enhancements
- Remove unused timeInterval in provisioning configurations (#137)
[3.2.4] - 2022-06-08
Bug Fixes
- Fix url params lost with cloud token in secure json data
Features
- Improve telegraf example and publish to Grafana (#133)
- Add install.sh as one-line installer
[3.2.3] - 2022-06-02
Bug Fixes
- Remove user/password in backend plugin config (#131)
Documentation
- Fix basic auth generation comment error (#130)
[3.2.2] - 2022-05-30
Bug Fixes
- Fix datasource test check bug (#128)
[3.2.1] - 2022-05-26
Bug Fixes
- Remove sensitive logging, fix ts layout format parsing method (#127)
[3.2.0] - 2022-05-25
Bug Fixes
- Fix bug when label not match while group by multi column (#124)
Documentation
- V3.1.7 released as signed (#121)
Features
- Group by multiple columns implicitly (#122)
- Store user, password, token in secureJsonData
- Use secureJsonData for all sensitive data
- Add dashboards tab in data source configuration page
[3.1.7] - 2022-05-14
CI
- Sign plugin before release (#119)
Features
- Add config option for cloud service token (#118)
[3.1.6] - 2022-05-05
Bug Fixes
- Change link to tdengine.com for plugin-check (#117)
[3.1.5] - 2022-05-05
Bug Fixes
- Rename timestamp _ts to ts (#112)
- Add --offline/--download-only pair options (#113)
- Fix warnings by grafana plugin validator (#116)
[TD-13076]<fix>
- Update dependencies (#99)
[TD-13320]<docs>
- Add instruction for TDinsight (#100)
- Enrich TDinsight introduction in en/cn (#101)
[TD-13366]<docs>
- Update installation instructions of datasource plugin in tdinsight (#102)
[TD-13540]<fix>
- Fail if grafana not installed in TDinsight.sh (#104)
[TD-13556]<feat>
- Add taosadapter metrics (#106)
[TD-13722]<fix>
- Remove Requests (Inserts) panel in Requests row (#105)
[TD-14180]<fix>
- Fix cpu and memory percent in taosAdapter (#108)
[TDREL-24]<docs>
- Add installation instruction for macOS (#110)
[3.1.4] - 2022-01-14
[TD-11474]<docs>
- Improve TDinsight documentations (#84)
[TD-11556]<docs>
- Add chinese version of TDinsight user manual (#85)
[TD-11589]<docs>
- Apply review suggestions (#87)
[TD-11900]<docs>
- Use relative image links for official website link (#90)
- Remove toc and fix images display in website (#92)
[TD-12501]<docs>
- Add upgrade/uninstall section for TDinsight (#94)
[TM-1532]<docs>
- Image minor fix for TDinsight (#93)
[TS-1125]<fix>
- Compatible to grafana 5.2.4 (#97)
[TS-781]<fix>
- Use show databases instead of select distinct(database_name) from vgroups_info (#91)
[TS-790]<fix>
- Fix incrrect time range in TDinsight disk/net panels (#88)
[3.1.3] - 2021-11-26
[10610]<fix>
- Fix TD-11023 TD-11024 TD-11079 TDinsight dashboard bugs (#71)
[TD-10610]<fix>
- Update TDinsight dashboard layout (#75)
- Push sms alert. (#77)
[TD-11003]<fix>
- Interval replaced once error
[TD-11078]<fix>
- Fix backend plugin error in case of integer types (#72)
[TD-11092]<fix>
- Consist TDinsight time interval by variable
- Update time interval and default it as auto
[TD-11147]<fix>
- Fill(null) caused taosadapter/httpd coredump (#76)
[TD-11242]<fix>
- Data source config sms. (#79)
[TD-11243]<feat>
- Add provisioning script for TDinsight (#81)
[TD-11245]<fix>
- Fix value mapping error in VNnodes Masters (#78)
[TD-11414]<fix>
- Grafanaplugin alert error. (#82)
[TD-11441]<fix>
- Fix ts layout error 2021-11-26T03:06:00Z and improve documents (#83)
[3.1.2] - 2021-11-12
[TD-10854]<fix>
- GENERATE SQL error.
[TD-11002]<release>
- Release v3.1.2 (#68)
[TS-552]<fix>
- Support group by col.
- Support group by col.
- Support group by col.
- Support group by col.
[3.1.1] - 2021-10-31
Bug Fixes
- Grafana-webhook submodule url not found (#64)
Documentation
- Fix directory name in package script
- Fix typo by @jtao1735
[TD-10584]<docs>
- Add TDengine Dashboard with alert support (#62)
[TD-10618]<fix>
- Generate the latest sql
[TD-10760]<fix>
- Could not locate user error.
- Could not locate user error.
[TD-10808]<release>
- Update grafana plugin version to v3.1.1 (#63)
[3.1.0] - 2021-10-27
Features
- 实现metricFindQuery方法,解决查询值的问题
[TD-10477]<fix>
- A much better dashboard for 7.x grafana (#38)
[TD-10484]<fix>
- B is not defined error. (#39)
[TD-10549]<fix>
- Grafana plugin alert error.
- Grafana plugin alert error.
[TD-10552]<docs>
- Add collectd dashboard example (#45)
[TD-10612]<docs>
- Support datasource selection in TDengine new dashboard (#50)
[TD-10617]<docs>
- Add grafana dashboard for telegraf (#43)
[TD-10618]<fix>
- Plugin variable repeat error. (#42)
[TD-10636]<docs>
- Add statsd fake dashboard (#46)
[TD-10637]<fix>
- Fix grafana dashboard error for telegraf (#47)
[TD-10774]<fix>
- Remove dist/ directory in grafanaplugin source (#52)
[TD-10777]<fix>
- Add CI and Release workflow in GitHub Actions, and fix warnings in submission (#54)
[TD-10791]<docs>
- Fix some typos, add howto section (#56)
[TD-4310]<feature>
- Support variables
[TD-4906]<fix>
- Fix demo dashboard import error in Grafana 6.2
[TD-5014]<feature>
- Support timeshift for query result
[TD-5109]<feature>
- Support arithmetic calculation among queris
[TD-5215]<fix>
- Fix read property 'status' of undefined
[TD-5232]<fix>
- Fix dashboard import unexpected view
[TD-5233]<enhance>
- Solve warnings in build
[TD-5736]<docs>
- Add how to monitor TDengine with Grafana document (#40)
[TD-6030]<fix>
- Tdengine restful api (#36)
[TS-76]<fix>
- Fix grafana datasource api in 6.x (#29)
<!-- generated by git-cliff -->