Plugins 〉Akvorado
Akvorado
Akvorado
Akvorado netflow data source using akvorado api
Introduction
This plugin aim to allow user to display akvorado data directly in Grafana.


Requirements
List any requirements or dependencies they may need to run the plugin.
Getting Started
In Grafana:
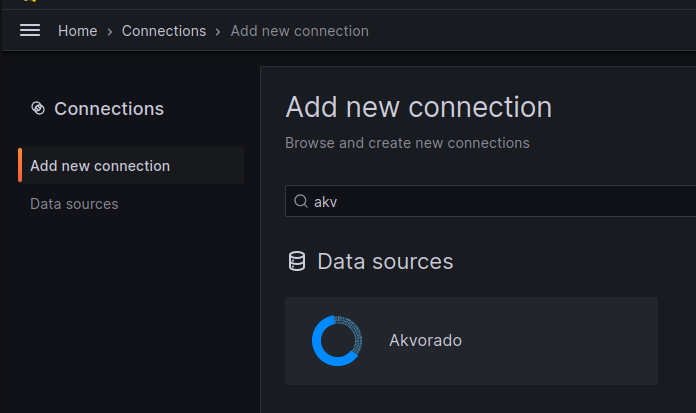
- Add new data source
- Akvorado
- Add new
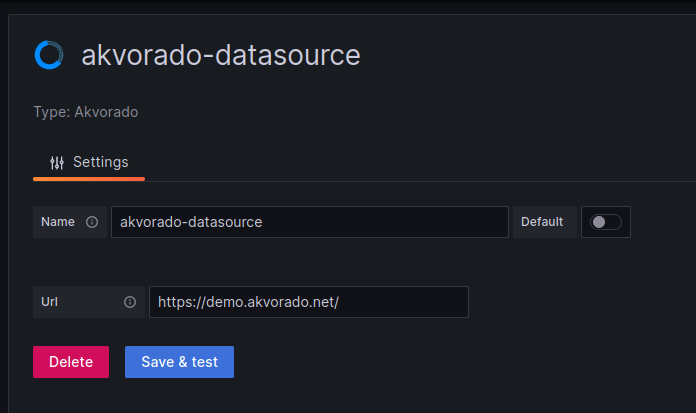
Akvoradodata source

- Enter the base url; eg: https://demo.akvorado.net/

Building queries
Queries can be built using pre-configured parameters.
Query parameters
- Tye of query:
- sankey
- When using sankey at least two dimension must be used
- timeseries
- sankey
- Unit
- l3bps
- pps
- Dimension
- Multiselect list: values are fetch from the back end
- Limit: number of returned result
- The number of return result is in fact limit +1 where +1 is the value "other" showing the aggregation of all other values
- Filters: expression to filter result
- The field is autocomplete and lint based on syntax checker
Query examples
Visualize the top 10 traffic per Source BGP AS for Ingress traffic, in bytes per second (pps)

Visualize the Top 10 Source BGP AS and Exporter Site for Ingress traffic, in packets per second (pps)

Contributing
If you want to contribute feel free to open a PR in this repo
Grafana Cloud Free
- Free tier: Limited to 3 users
- Paid plans: $55 / user / month above included usage
- Access to all Enterprise Plugins
- Fully managed service (not available to self-manage)
Self-hosted Grafana Enterprise
- Access to all Enterprise plugins
- All Grafana Enterprise features
- Self-manage on your own infrastructure
Installing Akvorado on Grafana Cloud:
Installing plugins on a Grafana Cloud instance is a one-click install; same with updates. Cool, right?
Note that it could take up to 1 minute to see the plugin show up in your Grafana.
Warning
Plugin installation from this page will be removed in February 2026. Use the Plugin Catalog in your Grafana instance instead. Refer to Install a plugin in the Grafana documentation for more information.
Installing plugins on a Grafana Cloud instance is a one-click install; same with updates. Cool, right?
Note that it could take up to 1 minute to see the plugin show up in your Grafana.
Installing plugins on a Grafana Cloud instance is a one-click install; same with updates. Cool, right?
Note that it could take up to 1 minute to see the plugin show up in your Grafana.
Warning
Plugin installation from this page will be removed in February 2026. Use the Plugin Catalog in your Grafana instance instead. Refer to Install a plugin in the Grafana documentation for more information.
Installing plugins on a Grafana Cloud instance is a one-click install; same with updates. Cool, right?
Note that it could take up to 1 minute to see the plugin show up in your Grafana.
Marketplace plugins
This is a paid plugin developed by a marketplace partner. To purchase an entitlement, sign in first, then fill out the contact form.
Get this plugin
This is a paid for plugin developed by a marketplace partner. To purchase entitlement please fill out the contact us form.
What to expect:
- Grafana Labs will reach out to discuss your needs
- Payment will be taken by Grafana Labs
- Once purchased the plugin will be available for you to install (cloud) or a signed version will be provided (on-premise)
Thank you! We will be in touch.
For more information, visit the docs on plugin installation.
Installing on a local Grafana:
For local instances, plugins are installed and updated via a simple CLI command. Plugins are not updated automatically, however you will be notified when updates are available right within your Grafana.
1. Install the Data Source
Use the grafana-cli tool to install Akvorado from the commandline:
grafana-cli plugins install The plugin will be installed into your grafana plugins directory; the default is /var/lib/grafana/plugins. More information on the cli tool.
Alternatively, you can manually download the .zip file for your architecture below and unpack it into your grafana plugins directory.
Alternatively, you can manually download the .zip file and unpack it into your grafana plugins directory.
2. Configure the Data Source
Accessed from the Grafana main menu, newly installed data sources can be added immediately within the Data Sources section.
Next, click the Add data source button in the upper right. The data source will be available for selection in the Type select box.
To see a list of installed data sources, click the Plugins item in the main menu. Both core data sources and installed data sources will appear.
Changelog
1.0.0 (Unreleased)
Initial release.


