Plugins 〉Pyris


Pyris
Pyris
A log viewer panel for Grafana with JSON and ANSI styling support.
- Full styling and link support for ANSI messages
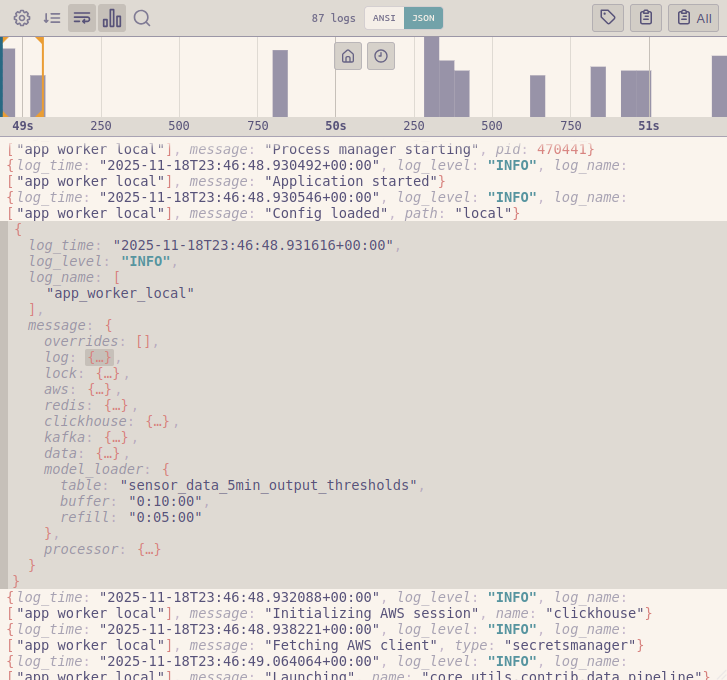
- Syntax highlighting and collapsible nesting for JSON messages
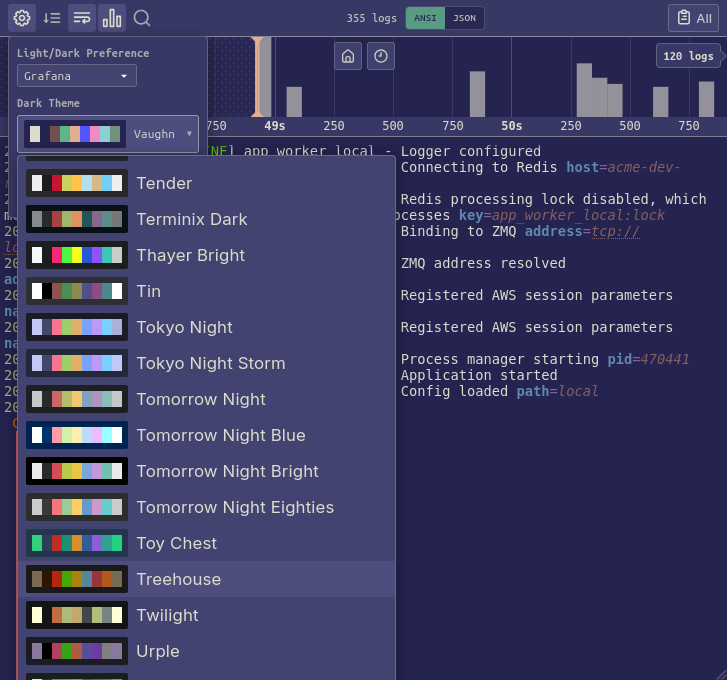
- Match log styling of your favorite terminal emulator or IDE with 300+ built-in color themes from Gogh, plus custom Grafana light/dark themes
- Easily navigate with a timeline chart of log records
- Virtual scrolling for handling large log volumes
Usage
Panel Layout
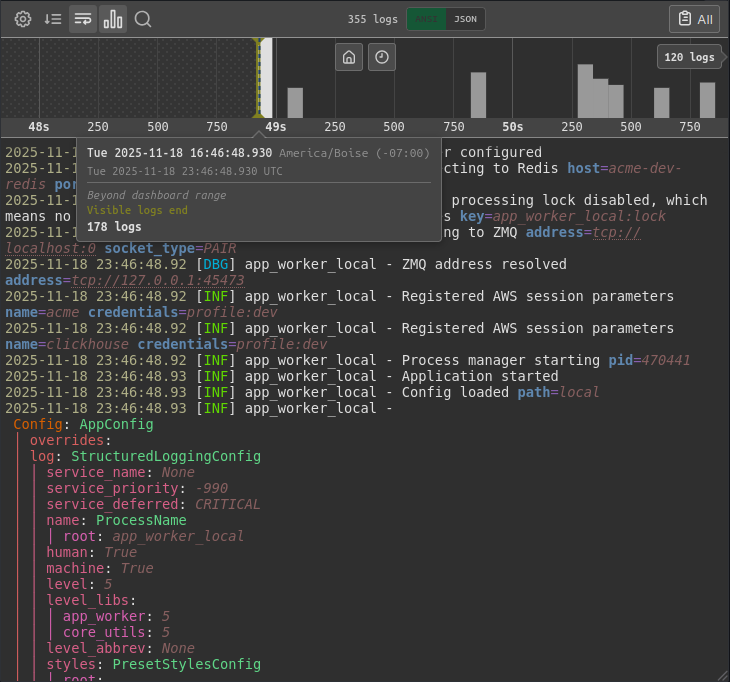
Settings: At the top of the panel is a header bar with various toggles and settings. On the left you'll see settings like theme, font size, or word-wrap.
Timeline: Next to settings is a toggle for the timeline chart. When shown, you'll see a bar chart with log records by time. Scroll to zoom, drag to pan. You can click a point on the timeline to find and scroll to the nearest record. You'll see other clickable elements like buttons to center the view, extend the view, or sync the dashboard's range. Vertical indicators show you your current selection, view, and dashboard range.
Search: Next to the timeline toggle is a search bar. Toggle this to enable/disable filtering. For ANSI log records, it searches by substring, optionally case sensitive or a regular expression. For JSON log records, you define a JavaScript lambda expression for filtering.
View: In the center you can toggle between viewing ANSI vs JSON logs. JSON logs are autodetected from records that look like JSON objects: a message enclosed in {} characters. When toggling between them, it will try to find a matching record based on keywords and sync the current scroll position. If a selected row is currently in view, it centers on a matching record instead.
Actions: On the right are actions like viewing record labels or copying.
Data Source
This panel works with any data source that returns log-like data. You can include multiple series. Each series should have these fields:
- Time: Prefers a field named
time, orts. Otherwise it picks the first time field. Otherwise it looks for the first UNIX timestamp-like field. - Message: Prefers a field named
message,msg,log,line,content, ortext. If not found, it picks the first string field. Otherwise it uses the field immediately after the time field. - Labels (optional): Prefers a JSON encoded string field named
labels,tags,metadata, orfields.
Contributing
See CONTRIBUTING.md for development setup and guidelines.
License
LGPL-3.0 - see LICENSE for details.
Grafana Cloud Free
- Free tier: Limited to 3 users
- Paid plans: $55 / user / month above included usage
- Access to all Enterprise Plugins
- Fully managed service (not available to self-manage)
Self-hosted Grafana Enterprise
- Access to all Enterprise plugins
- All Grafana Enterprise features
- Self-manage on your own infrastructure
Install on Grafana Cloud
Plugins can be installed directly from within your Grafana instance or automated using the Cloud API or Terraform.
Learn more about plugin installationMarketplace plugins
This is a paid plugin developed by a marketplace partner. To purchase an entitlement, sign in first, then fill out the contact form.
Get this plugin
This is a paid for plugin developed by a marketplace partner. To purchase entitlement please fill out the contact us form.
What to expect:
- Grafana Labs will reach out to discuss your needs
- Payment will be taken by Grafana Labs
- Once purchased the plugin will be available for you to install (cloud) or a signed version will be provided (on-premise)
Thank you! We will be in touch.
For more information, visit the docs on plugin installation.
Installing on a local Grafana:
For local instances, plugins are installed and updated via a simple CLI command. Plugins are not updated automatically, however you will be notified when updates are available right within your Grafana.
1. Install the Panel
Use the grafana-cli tool to install Pyris from the commandline:
grafana-cli plugins install The plugin will be installed into your grafana plugins directory; the default is /var/lib/grafana/plugins. More information on the cli tool.
Alternatively, you can manually download the .zip file for your architecture below and unpack it into your grafana plugins directory.
Alternatively, you can manually download the .zip file and unpack it into your grafana plugins directory.
2. Add the Panel to a Dashboard
Installed panels are available immediately in the Dashboards section in your Grafana main menu, and can be added like any other core panel in Grafana.
To see a list of installed panels, click the Plugins item in the main menu. Both core panels and installed panels will appear.
Changelog
v1.1.1
- "Open" modal button is hidden for dangerous URL schemes
v1.1.0
- React 19 updates for Grafana 13 (@jackw)
- Updated provisioning samples
Dropped support for Grafana 10
v1.0.9
Features
- Themes can now be configured per-panel, rather than just globally
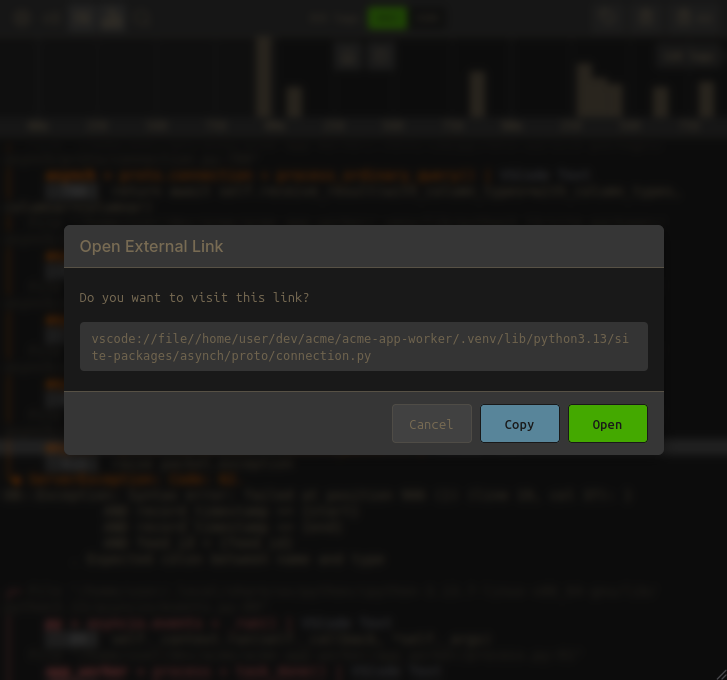
- Unix file path linkification in ANSI output
- Copy-on-click for style-delimited tokens in ANSI mode
Fixes
- Fix hover buttons on titleless Grafana panels covering panel buttons
- Fix default panel theme not getting used
- Fix theme selector styling in panel settings
- Fix JSON scroll jank in nowrap mode
- Fix JSON copying
- Fix linkification edge cases
Internals / tooling
- Cleaned up ANSI → HTML conversion code
- Added signed-release verification script
- Release build now produces signed artifacts
- Anonymization template script for sample contributions
- Updated provisioning samples
v1.0.8
- Remove all logging in production builds
- Switch to jexl library for JSON log filtering
- Fix line wrap rendering bug
v1.0.7
Initial public release. See README for overview of the project.