Plugins 〉Kentik


Kentik
Kentik for Grafana
The Kentik datasource plugin allows you to query the Kentik API and visualize network traffic data directly in Grafana. It leverages the Kentik Network Observability Platform to provide real-time, Internet-scale ingest and querying of network data including flow records (NetFlow, IPFIX, sFlow), BGP, GeoIP, and SNMP.
The plugin provides instant access to the Kentik Data Engine (KDE), enabling you to seamlessly integrate network activity metrics into your Grafana dashboards.
Requirements
- A Grafana instance (v10.4 or later)
- An active Kentik account with API access
- Devices registered in the Kentik portal
Getting Started
- Navigate to Data Sources in Grafana.
- Add Kentik.
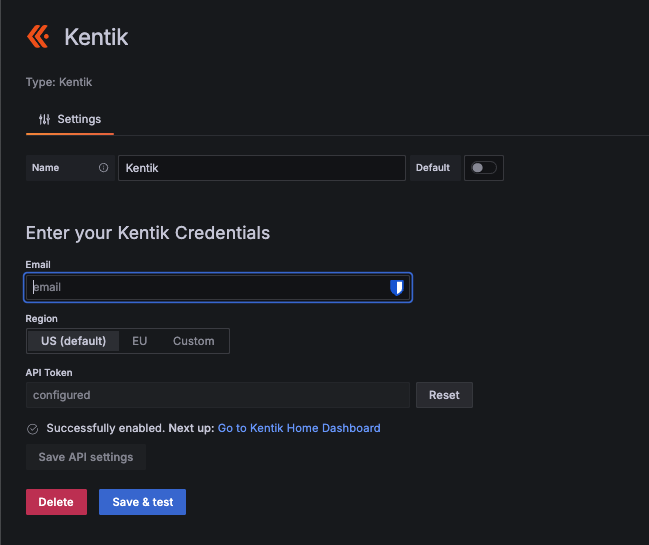
- Select the appropriate Region (US, EU, or Custom).
- Enter your Kentik Email and API Token.
- Click Save & Test to verify connectivity.
Features
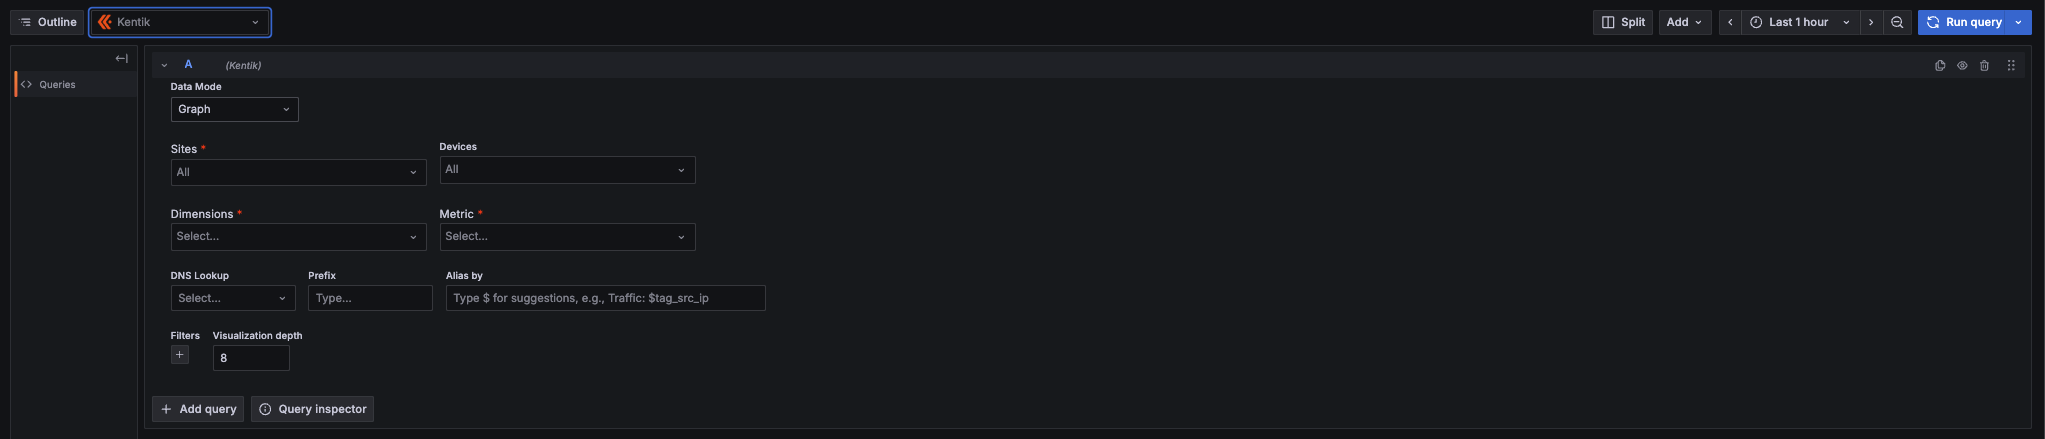
- Granular Visibility: View traffic by time range, devices, sites, and over 200 dimensions across 20+ categories.
- Multi-Select Support: Select multiple sites, devices, and up to 8 dimensions simultaneously.
- NMS / SNMP Support: Query SNMP device and interface metrics alongside traditional flow data.
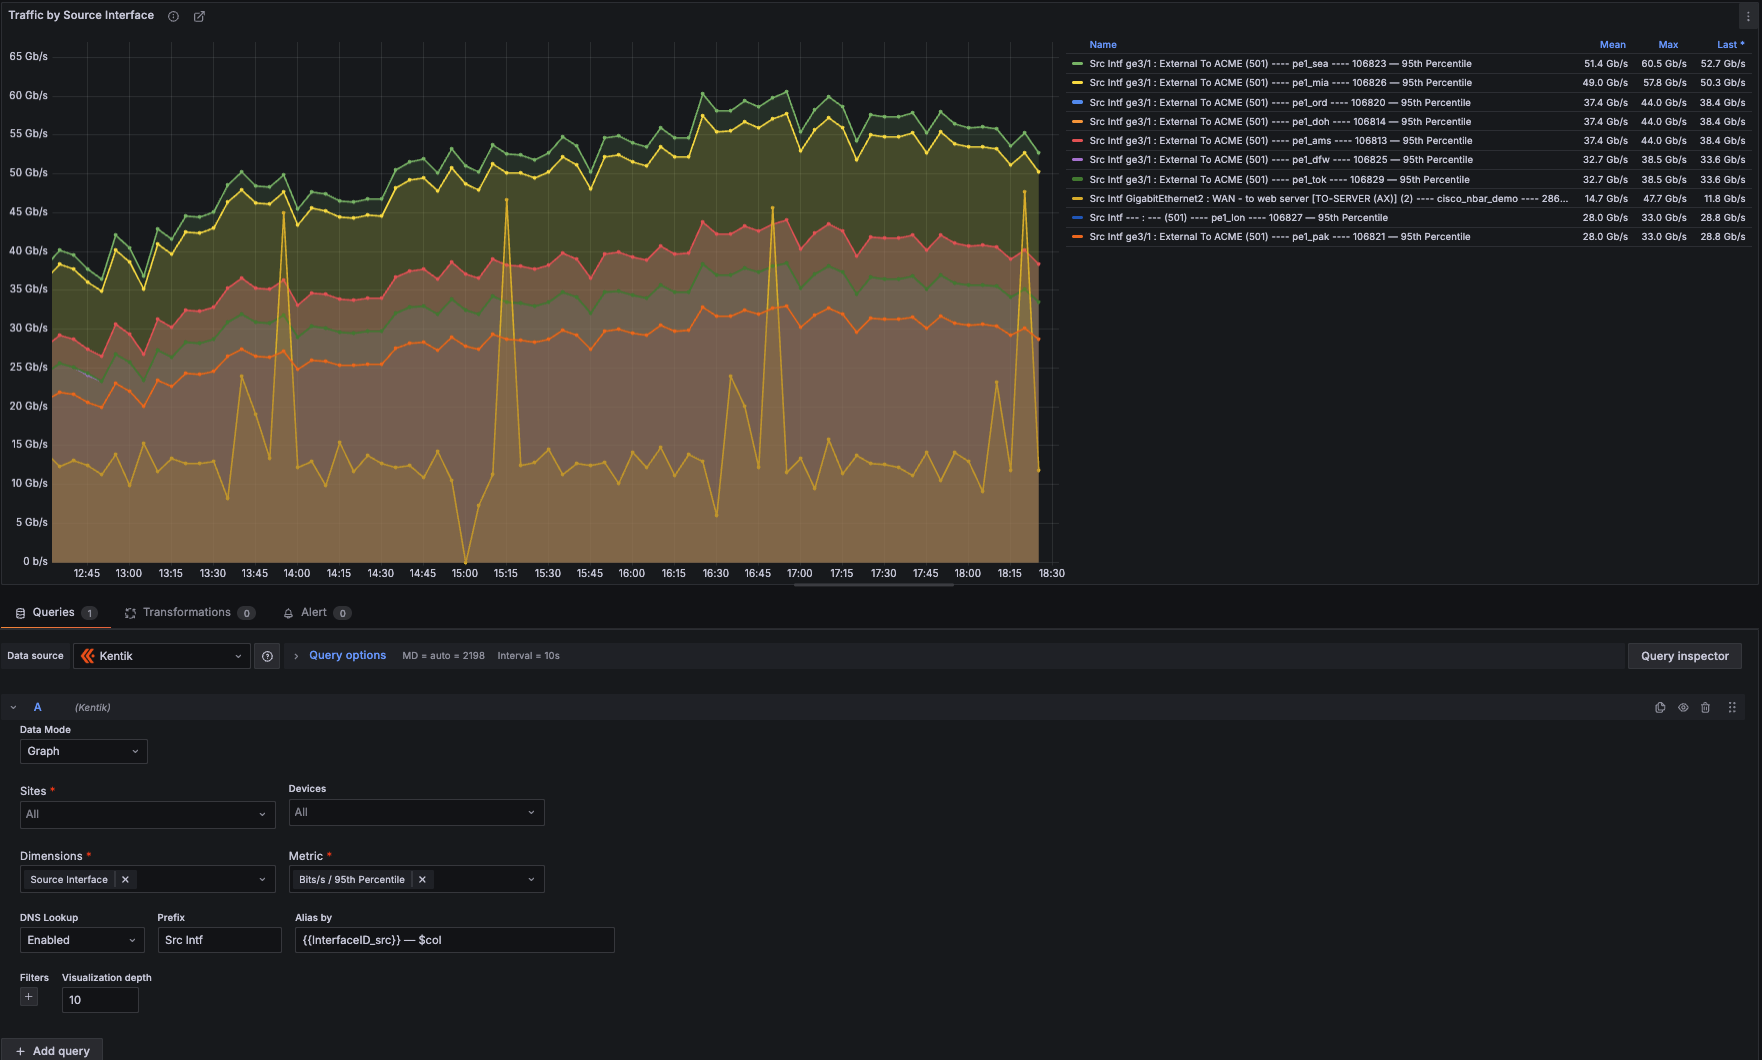
- Smart Labeling: Customize graph legends using Alias and Prefix fields with autocomplete (e.g.,
{{Source Interface}},$col,$metric_group). - Drilldown Workflows: Deep-link URLs to the Kentik Portal for detailed investigation.
Documentation
For more information, visit Kentik Documentation.
Grafana Cloud Free
- Free tier: Limited to 3 users
- Paid plans: $55 / user / month above included usage
- Access to all Enterprise Plugins
- Fully managed service (not available to self-manage)
Self-hosted Grafana Enterprise
- Access to all Enterprise plugins
- All Grafana Enterprise features
- Self-manage on your own infrastructure
Installing Kentik on Grafana Cloud:
Installing plugins on a Grafana Cloud instance is a one-click install; same with updates. Cool, right?
Note that it could take up to 1 minute to see the plugin show up in your Grafana.
Warning
Plugin installation from this page will be removed in February 2026. Use the Plugin Catalog in your Grafana instance instead. Refer to Install a plugin in the Grafana documentation for more information.
Installing plugins on a Grafana Cloud instance is a one-click install; same with updates. Cool, right?
Note that it could take up to 1 minute to see the plugin show up in your Grafana.
Installing plugins on a Grafana Cloud instance is a one-click install; same with updates. Cool, right?
Note that it could take up to 1 minute to see the plugin show up in your Grafana.
Warning
Plugin installation from this page will be removed in February 2026. Use the Plugin Catalog in your Grafana instance instead. Refer to Install a plugin in the Grafana documentation for more information.
Installing plugins on a Grafana Cloud instance is a one-click install; same with updates. Cool, right?
Note that it could take up to 1 minute to see the plugin show up in your Grafana.
For more information, visit the docs on plugin installation.
Installing on a local Grafana:
For local instances, plugins are installed and updated via a simple CLI command. Plugins are not updated automatically, however you will be notified when updates are available right within your Grafana.
1. Install the Data Source
Use the grafana-cli tool to install Kentik from the commandline:
grafana-cli plugins install The plugin will be installed into your grafana plugins directory; the default is /var/lib/grafana/plugins. More information on the cli tool.
Alternatively, you can manually download the .zip file for your architecture below and unpack it into your grafana plugins directory.
Alternatively, you can manually download the .zip file and unpack it into your grafana plugins directory.
2. Configure the Data Source
Accessed from the Grafana main menu, newly installed data sources can be added immediately within the Data Sources section.
Next, click the Add data source button in the upper right. The data source will be available for selection in the Type select box.
To see a list of installed data sources, click the Plugins item in the main menu. Both core data sources and installed data sources will appear.
Changelog
All notable changes to this project will be documented in this file.
2.0.0 (2026-03-15)
Features:
- Batch topXdata queries to reduce API calls and improve dashboard load time
- New OSI Health dashboard with per-layer network panels and alias patterns
- New Site & Device Overview dashboard with heatmap, status history, and bar chart panels
- "Open in Kentik" panel links for direct portal navigation
- Support for custom/on-prem portal URL derivation from region config
Improvements:
- Client-side Kentik portal URL eliminates separate /query/url API calls
- Dynamic query depth scales with topx setting for faster server processing
- Null safety in batch response handling
- Home dashboard modernized (schemaVersion 39, replaced broken custom panel with standard text panel)
- Dashboards now included in plugin zip for provisioning support
- Updated create-plugin tooling from 6.1.3 → 7.0.8
- All ESLint errors resolved (24 → 0)
- Provisioning README with full reviewer setup guide
CI/CD:
- Fixed duplicate
env:block and staleworking-directoryrefs in release workflow - Added Playwright E2E test job with Grafana version matrix to CI
- Plugin validator runs in CI on every PR
Cleanup:
- Removed dead code: DescriptionPanel, unused SCSS styles, stale
.eslintrc - Fixed
.prettierrc.jsreference to removed@grafana/toolkit - Updated documentation link in
plugin.json - Fixed
.gitignoreto track E2E test files
Breaking changes:
- Minimum Grafana version: 11.6.0
- Plugin type changed from
apptodatasource; plugin ID changed fromkentik-connect-apptokentik-connect-datasource(required by Grafana's validator — datasource plugins must use the-datasourcesuffix). Both plugins can run side-by-side; existingkentik-connect-appv1.7.0 dashboards remain functional while you migrate at your own pace. See v2.0.0 release notes for migration steps.
[1.7.0] - 2023-06-27
Please note, the release contains breaking changes. After the update, it's necessary to:
- restart Grafana
- go to Plugins -> Kentik Connect Pro, click Disable button, then click Enable
Changed
- Migrate the plugin from Angular to React #76
[1.6.2] - 2023-03-31
Fixed
- API - Grafana plugin hitting 429's through device calls #69
[1.6.1] - 2022-07-21
- Query Editor:
- new Filter in addition to the available on the top of the dashboard
- support setting filter values either as a dropdown or as a template variable
- support "OR" operator in addition to "AND"
- support multiple metrics in a panel
- be able to select Site as source
[1.6.0] - 2022-02-24
- Added support for Grafana version 8
- Build tooling support for official plugin
[1.5.0] - 2021-08-06
Breaking changes
Plugin ID is changed according to Grafana convention: kentik-app -> kentik-connect-app.
Please refer to the updated installation instructions before updating. It's important to remove the existing plugin and enable the plugin in Grafana again.
[1.4.2] - 2021-05-21
Fixed
- Filter field "inet_dst_addr" does not support the operator "=" error #36
Changed
- Remove old unsupported filters
[1.4.1] - 2020-09-25
Fixed
- 403 error when using non-admin Kentik user #31
[1.4.0] - 2019-12-26
Breaking changes
Fixed "Permission denied" error for Viewers and Editors #28.
Because of #28 it's required to do after update:
- restart Grafana
- go to the plugin config (e.g. http://localhost:3000/plugins/kentik-app/) and click "Update"
[1.3.6] - 2019-10-02
New Features
- Resolve IPs in a given view #5
[1.3.5] - 2019-09-23
Autocomplete for plugin #4
[1.3.4] - 2019-05-24
- Added support for custom api endpoints, #71
[1.3.3] - 2019-02-01
New Features
- Added support for EU api endpoint, #64
Fixed
- click-through to device-details page now works correctly
Changed
- Updated device-details page to show more data
- device-details page now displays more informative messages when updating fails
[1.3.2] - 2018-12-18
New Features
- Added better error messaging for API issues, #61
[1.3.1] - 2018-11-13
Fixed
- Filter operators do not match Group By operators, #37
[1.3.0] - 2018-10-22
New Features
[1.2.4] - 2017-05-22
New Features
- Test for Kentik query builder
Changed
- Enable stacking by default in Kentik top talkers dashboard
Fixed
- Unique Src/Dst IPs metrics (after Kentik API update)
- Table data columns for Unique Src/Dst IPs metrics (now is Avg, p95th, Max, p95th mbps, p95th pps)