Plugins 〉NetApp ONTAP


NetApp ONTAP
NetApp ONTAP Data Source Plugin for Grafana
Description
The NetApp ONTAP DataSource Plugin is a Grafana backend datasource plugin that enables on-demand querying and visualization of storage metrics and operational data from NetApp ONTAP systems using the ONTAP REST API.
NetApp ONTAP is an enterprise-grade storage operating system that provides unified data management across SAN, NAS, and cloud environments. It offers capabilities for storage provisioning, performance monitoring, data protection, and network management. This plugin provides visibility into ONTAP clusters by allowing users to explore and monitor key resources such as clusters, volumes, LUNs, disks, and network components directly within Grafana dashboards.
Features
- Query and visualize storage metrics and operational data from NetApp ONTAP directly within Grafana
- Support for multiple ONTAP resource types including Cluster, Volume, LUN, Disk, Ethernet Port, and Network Interface
- Interval-based querying mechanism to align with ONTAP REST API constraints
- Real-time monitoring and analysis of storage performance and health metrics
- Flexible query configuration to explore different resource-level insights
- Compatibility with Grafana panels for building custom dashboards and visualizations
- Built-in retry logic with exponential backoff for transient failures
- Optimized API interaction to ensure efficient data retrieval from ONTAP systems
Compatibility
| Component | Version / Detail |
|---|---|
| Grafana | >= 12.3.0 |
| NetApp ONTAP | >= 9.17 (9.17+ recommended for full API support) |
| ONTAP REST API | v1 |
| Authentication | Basic Auth (Username + Password, optional CA Certificate support) |
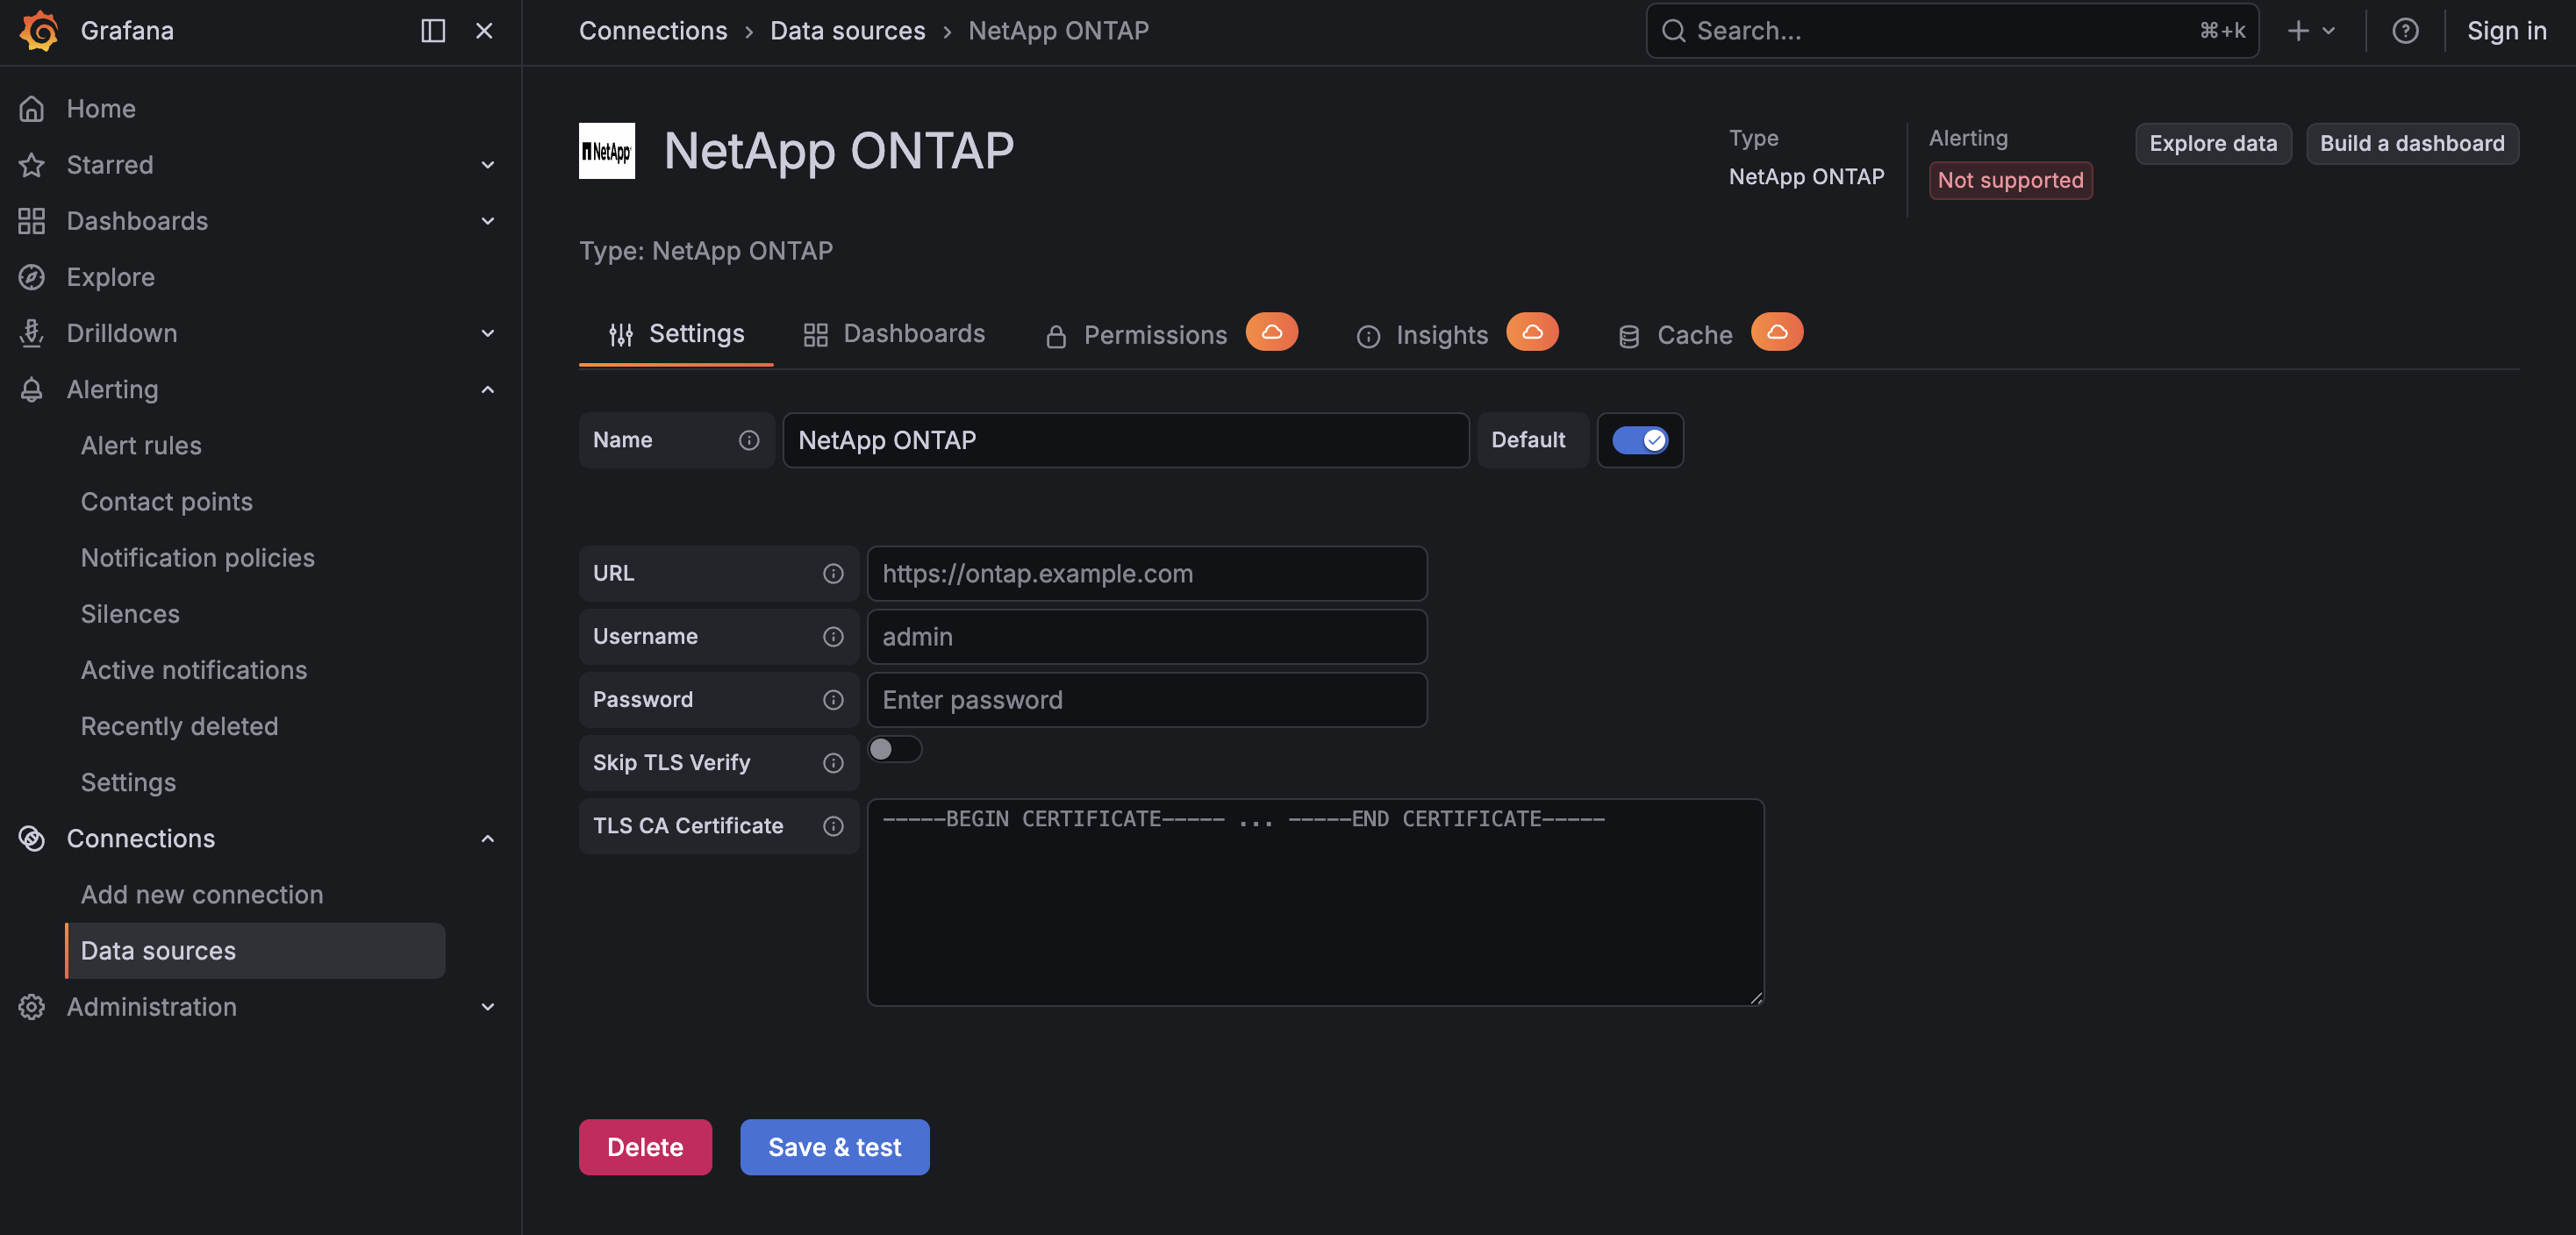
Visuals
Configuration Editor

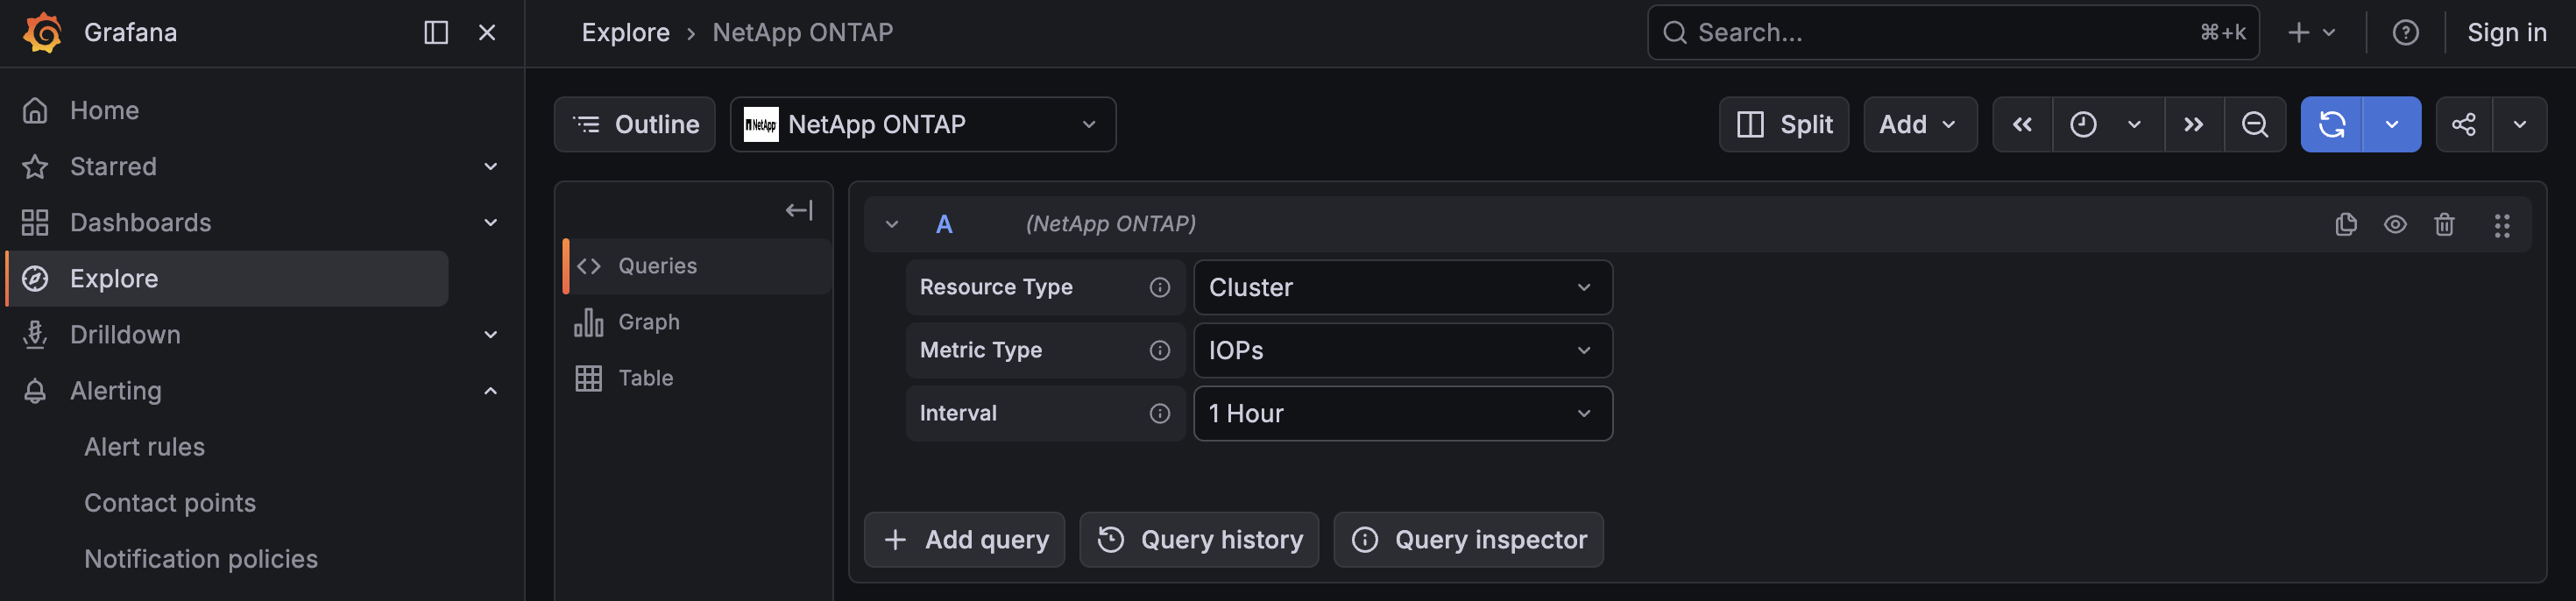
Query Editor

Installation
Requirements
- Grafana >= 12.3.0
- Access to a NetApp ONTAP cluster
- ONTAP REST API enabled on the cluster
- Valid ONTAP credentials (Username & Password) with appropriate permissions
Obtaining ONTAP Credentials
- Login to the ONTAP System Manager or CLI.
- Ensure that the REST API is enabled on the cluster.
- Create or use an existing user with sufficient privileges to query cluster and storage resources.
- Note down the following details:
- Cluster Management IP / Hostname
- Username
- Password
Install the Plugin
Install the plugin from the Grafana Plugin Catalog or using the Grafana CLI:
grafana cli plugins install crestdata-netappontap-datasource
After installation, restart the Grafana server for the plugin to be loaded.
Configure the Data Source
- In Grafana, navigate to Connections > Data Sources > Add data source.
- Search for NetApp ONTAP and select it.
- Fill in the required configuration fields:
| Name | Type | Required | Description |
|---|---|---|---|
| URL | String | Yes | NetApp ONTAP cluster URL (e.g., https://ontap.example.com) |
| Username | String | Yes | Username for authentication |
| Password | Secured String | Yes | Password for authentication |
| Skip TLS Verify | Boolean | Yes | Skip verify |
| TLS CA Certificate | String | Yes | Custom CA certificate in PEM format for validating self-signed certificates. Leave empty to use system certificates. Only used when Skip TLS Verify is disabled. |
- Click Save & Test. The health check will validate your credentials against the NetApp ONTAP API.
Usage
Query Editor
Once the data source is configured, you can create panels using the query editor with the following parameters:
| Parameter | Type | Options | Default | Description |
|---|---|---|---|---|
| Resource Type | Dropdown | Cluster, Volume, LUN, Disk, Ethernet Port, Network Interface | Cluster | Type of ONTAP resource to query. |
| Metric Type | Dropdown | Varies based on Resource Type | Varies based on Resource Type | Filter events by threat status |
| Resource Identifier | String | NA | NA | UUID of specific resource identifier for targeted queries. Resource Identifier will only be visible for selected Metric Types. |
| Interval | Dropdown | 1h, 1d, 1w, 1m, 1y | 1h | Interval to fetch data. Interval will only be visible for selected Metric Types. |
Time Range Handling
The NetApp ONTAP REST API does not support querying data using arbitrary from and to timestamps.
To address this:
- The plugin uses a predefined interval parameter instead of Grafana’s default time range
- Users must select from supported intervals (e.g., 1h, 1d, 1w, etc.)
- Grafana time picker does not directly influence the query results
This ensures compatibility with the ONTAP API while maintaining predictable query behavior.
Error Handling and Retry Strategy
Retries are performed only for transient failures:
- HTTP 429 (rate limited)
- HTTP 5xx responses (500–599)
- Network/connection-level errors
- Errors while reading the response body
Max retry attempts: 3, with exponential backoff.
Non-retryable: HTTP 4xx errors (e.g., 401, 403) are returned immediately.
Pre-built Dashboards
The plugin ships with six pre-built dashboards for quick visualization and monitoring of ONTAP environments.
| Setting | Value |
|---|---|
| Default time range | Last 1 hour (now-1h to now) |
| Auto-refresh | Enabled |
| Datasource selection | Template variable (dropdown for selecting the ONTAP instance) |
1. NetApp ONTAP – Cluster Overview — Provides a high-level view of cluster performance, including:
- Throughput metrics
- IOPs metrics
- Latency metrics
2. NetApp ONTAP – Disks — Displays disk-level insights, including:
- Disk inventory and status
- Disk performance metrics
3. NetApp ONTAP – Volumes — Detailed monitoring of storage volumes, including:
- Volume inventory
- Throughput, IOPs, Latency metrics
4. NetApp ONTAP – LUNs — Insights into LUN performance and usage:
- LUN details
- Throughput, IOPs, Latency metrics
5. NetApp ONTAP – Network Interface — Monitoring of network interfaces:
- Interface details
- Throughput metrics
6. NetApp ONTAP – Ethernet Ports — Provides visibility into physical network ports:
- Ethernet port details
- Throughput metrics
Limitations
API Limitation: The underlying API does not support querying data using arbitrary time ranges defined by explicit from and to timestamps. Instead, it only allows data retrieval based on a fixed set of predefined interval values (e.g., 1h, 1d, 1w, 1m, 1y) This restricts the ability to fetch data for custom time windows and limits flexibility in time-based filtering.
Design Adaptation To accommodate the above limitation, the integration does not utilize the default from and to time range parameters provided by Grafana. Instead, a custom interval parameter has been introduced. This interval parameter aligns with the set of supported values exposed by the API and enables users to select from predefined time ranges. While this ensures compatibility with the API, it also means that users cannot define fully custom time intervals within Grafana.
Support
For issues, questions, or feature requests, please open an issue in this repository.
Roadmap
See the open issues for a list of proposed features and known issues.
Contributing
Contributions are welcome! To get started with development:
cd crestdata-netappontap-datasource
Frontend
npm install
npm run dev        # development mode with watch
npm run build      # production build
Backend
mage -v            # build backend binaries
Tests
npm run test       # frontend tests (Jest)
npm run test:ci    # CI mode
go test ./…      # backend tests
Linting
npm run lint
npm run lint:fix
Local Grafana instance (Docker)
npm run server
E2E tests (Playwright)
npm run e2e
Before submitting a pull request:
- Run the linter and ensure all tests pass.
- Validate the plugin using the Grafana Plugin Validator.
- Ensure any changes to
plugin.jsonare intentional — a Grafana server restart is required after such changes.
Authors and Acknowledgment
Developed by Crest Data.
License
This plugin is distributed under EULA. LICENSE.
References
Grafana Cloud Free
- Free tier: Limited to 3 users
- Paid plans: $55 / user / month above included usage
- Access to all Enterprise Plugins
- Fully managed service (not available to self-manage)
Self-hosted Grafana Enterprise
- Access to all Enterprise plugins
- All Grafana Enterprise features
- Self-manage on your own infrastructure
Install on Grafana Cloud
Plugins can be installed directly from within your Grafana instance or automated using the Cloud API or Terraform.
Learn more about plugin installationMarketplace plugins
This is a paid plugin developed by a marketplace partner. To purchase an entitlement, sign in first, then fill out the contact form.
Get this plugin
This is a paid for plugin developed by a marketplace partner. To purchase entitlement please fill out the contact us form.
What to expect:
- Grafana Labs will reach out to discuss your needs
- Payment will be taken by Grafana Labs
- Once purchased the plugin will be available for you to install (cloud) or a signed version will be provided (on-premise)
Thank you! We will be in touch.
For more information, visit the docs on plugin installation.
Installing on a local Grafana:
For local instances, plugins are installed and updated via a simple CLI command. Plugins are not updated automatically, however you will be notified when updates are available right within your Grafana.
1. Install the Data Source
Use the grafana-cli tool to install NetApp ONTAP from the commandline:
grafana-cli plugins install The plugin will be installed into your grafana plugins directory; the default is /var/lib/grafana/plugins. More information on the cli tool.
Alternatively, you can manually download the .zip file for your architecture below and unpack it into your grafana plugins directory.
Alternatively, you can manually download the .zip file and unpack it into your grafana plugins directory.
2. Configure the Data Source
Accessed from the Grafana main menu, newly installed data sources can be added immediately within the Data Sources section.
Next, click the Add data source button in the upper right. The data source will be available for selection in the Type select box.
To see a list of installed data sources, click the Plugins item in the main menu. Both core data sources and installed data sources will appear.
Changelog
1.0.5
- Added public link for license.
1.0.4
- Added public link for screenshots present in Readme.
1.0.3
- Aligned the version across plugin.json, CHANGELOG, and the release tag
1.0.2
- Updated EULA in license
- Updated Dashboards to reference the existing panels
1.0.1
- Updated backend logger
- Updated TLS verification logic
1.0.0
Initial release.