Plugins 〉FortiGate


FortiGate

FortiGate Data Source Plugin for Grafana
Description
The FortiGate DataSource Plugin is a Grafana backend datasource plugin that enables on-demand querying and visualization of FortiGate security logs and monitoring data inside Grafana panels.
FortiGate is a network security appliance developed by Fortinet that provides unified threat management (UTM) capabilities including firewall, antivirus, intrusion prevention, web filtering, anti-spam, and VPN functionality. FortiGate devices generate comprehensive security logs that provide valuable insights into network traffic, security events, and system operations.
Features
- Query and visualize FortiGate logs directly within Grafana through the FortiGate REST API
- Support for multiple log categories: Traffic Logs, UTM Logs (Antivirus Stats, Webfilter), and Event Logs
- Support for multiple storage types: Disk (historical), Memory (real-time), and FortiCloud
- UTM webfilter monitoring for malicious URLs and trusted URLs in real-time
- Advanced filtering with multiple operators (==, !=, =@, !@, <=, <, >=, >, AND, OR)
- Automatic pagination handling for large datasets (5000 records per chunk)
- Built-in retry logic with exponential backoff for transient failures
- Rate limiting compliance (100 requests per minute)
- Three pre-built dashboards for immediate insight into network security data
Compatibility
| Component | Version / Detail |
|---|---|
| Grafana | >= 12.3.0 |
| FortiGate Product | FortiGate, FortiOS |
| FortiOS REST API | v2 (FortiOS 7.6.6) |
| Authentication | Bearer Token (API Token) |
Visuals
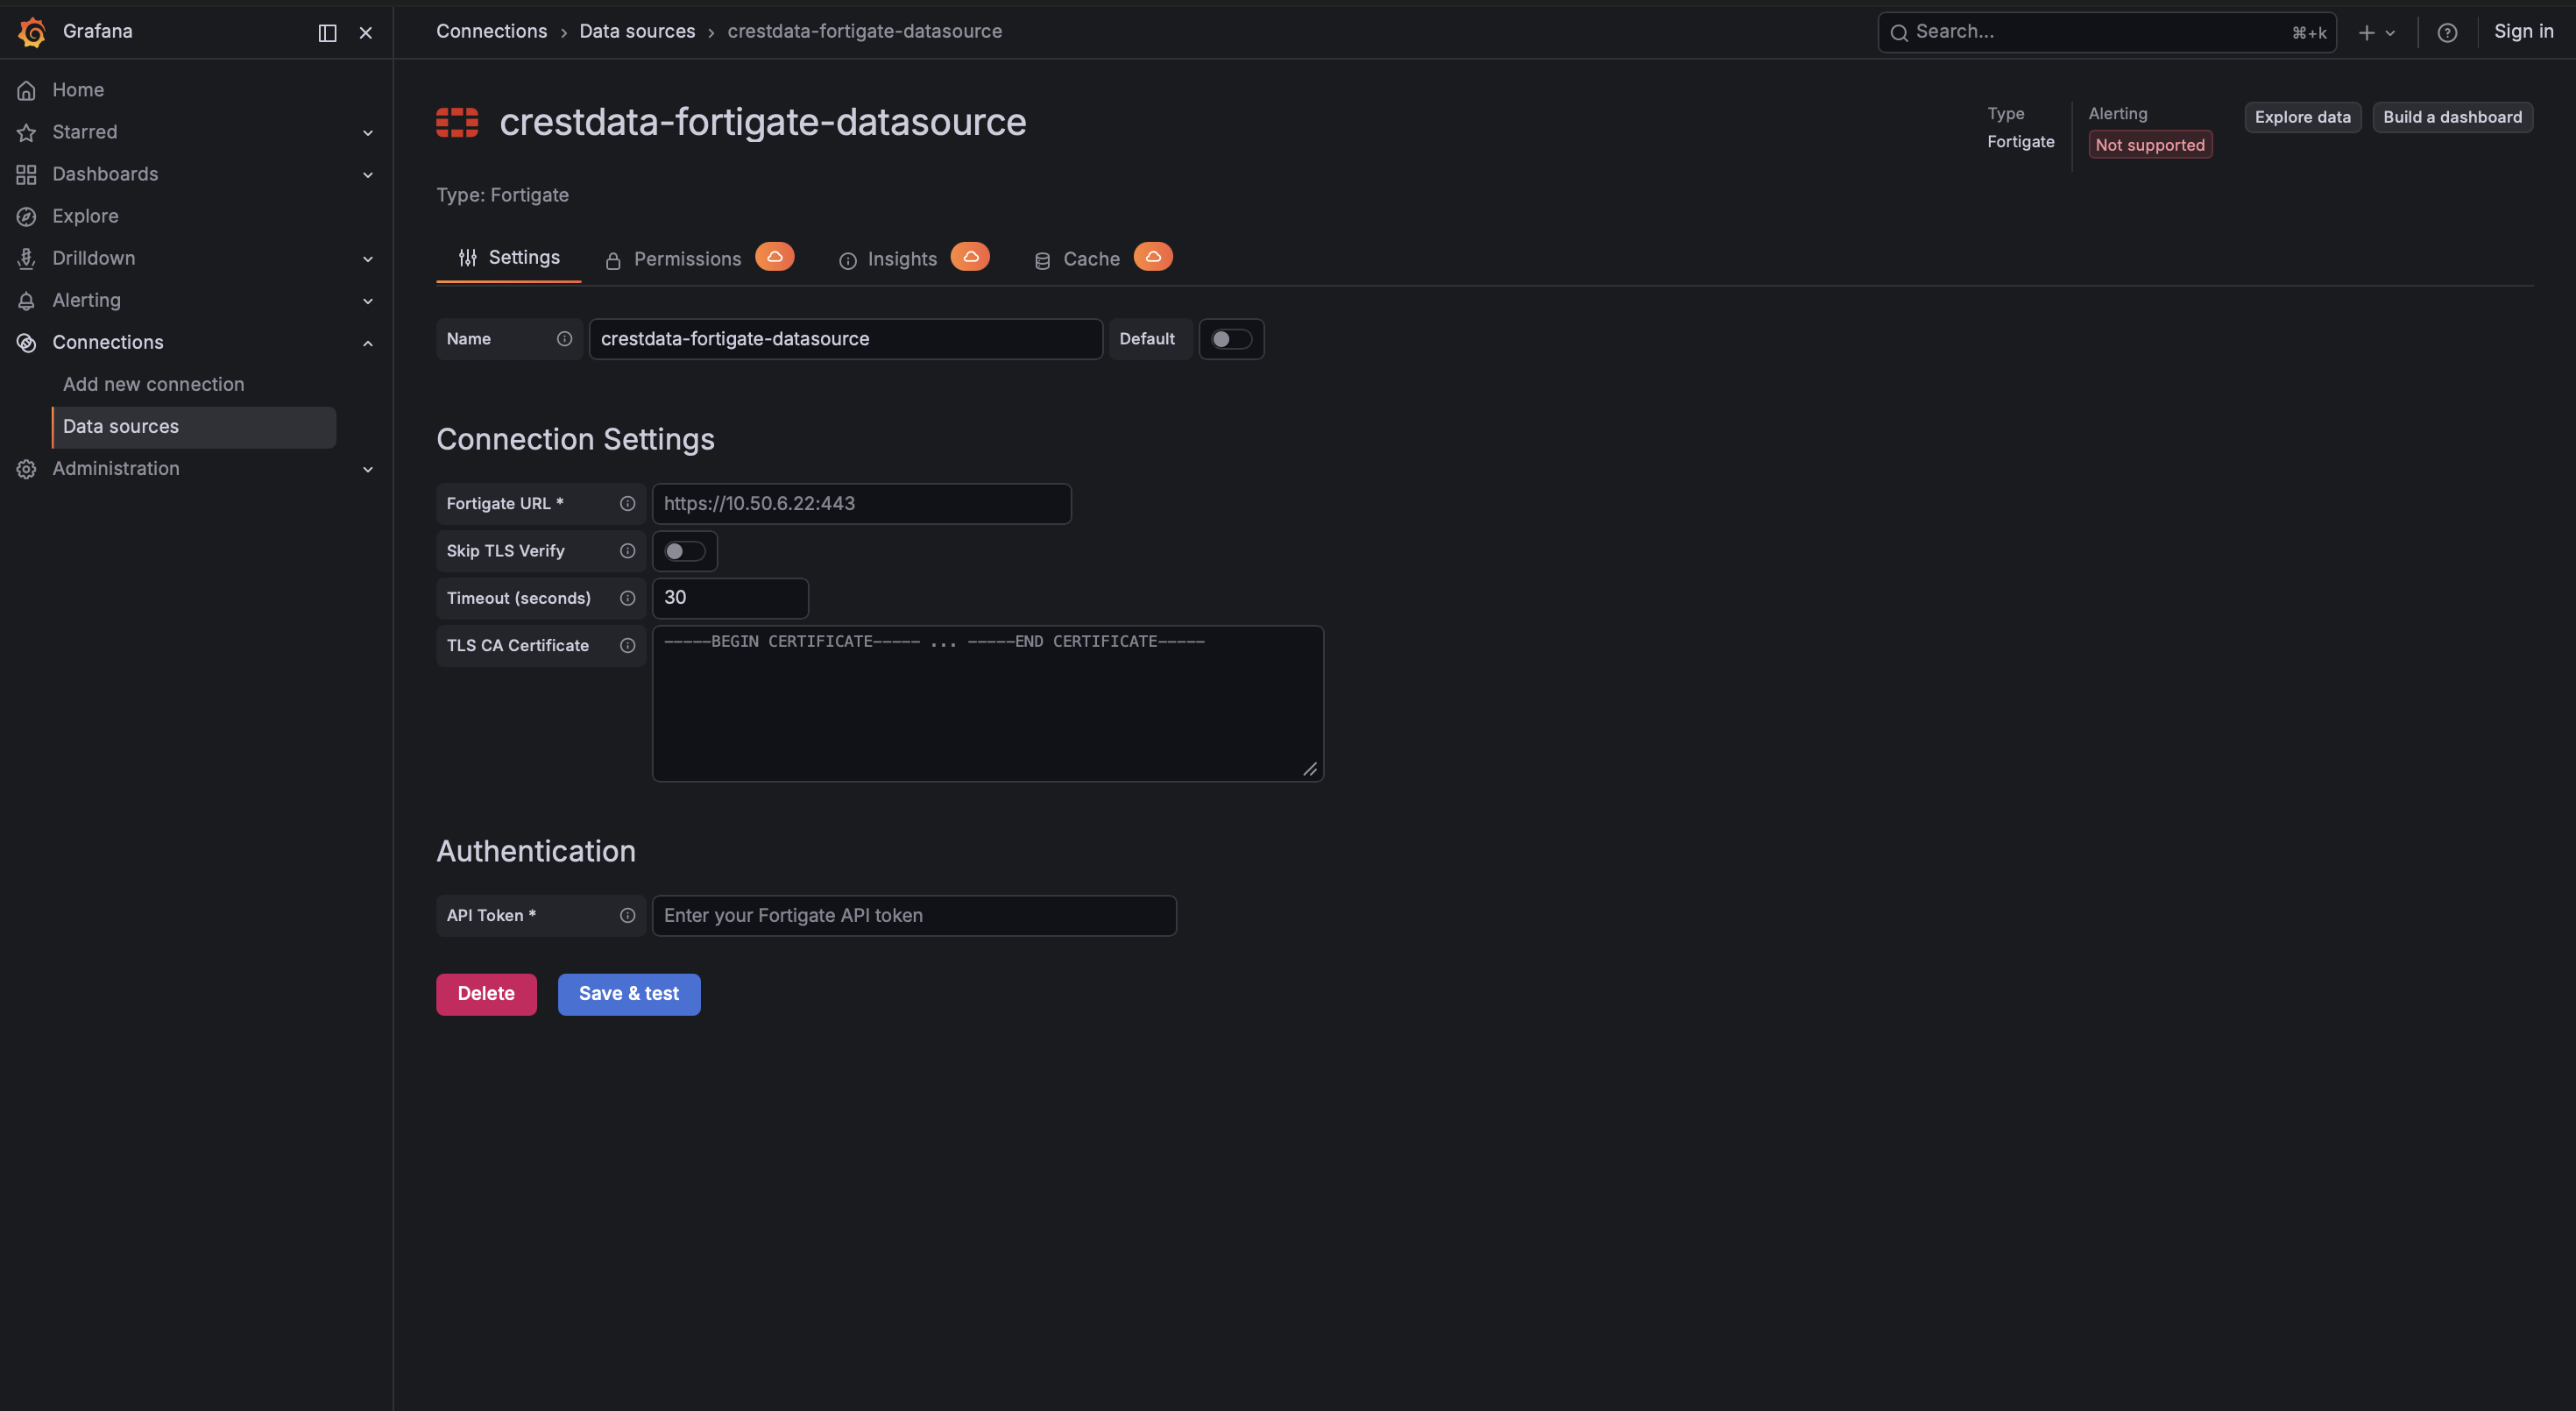
Configuration Editor
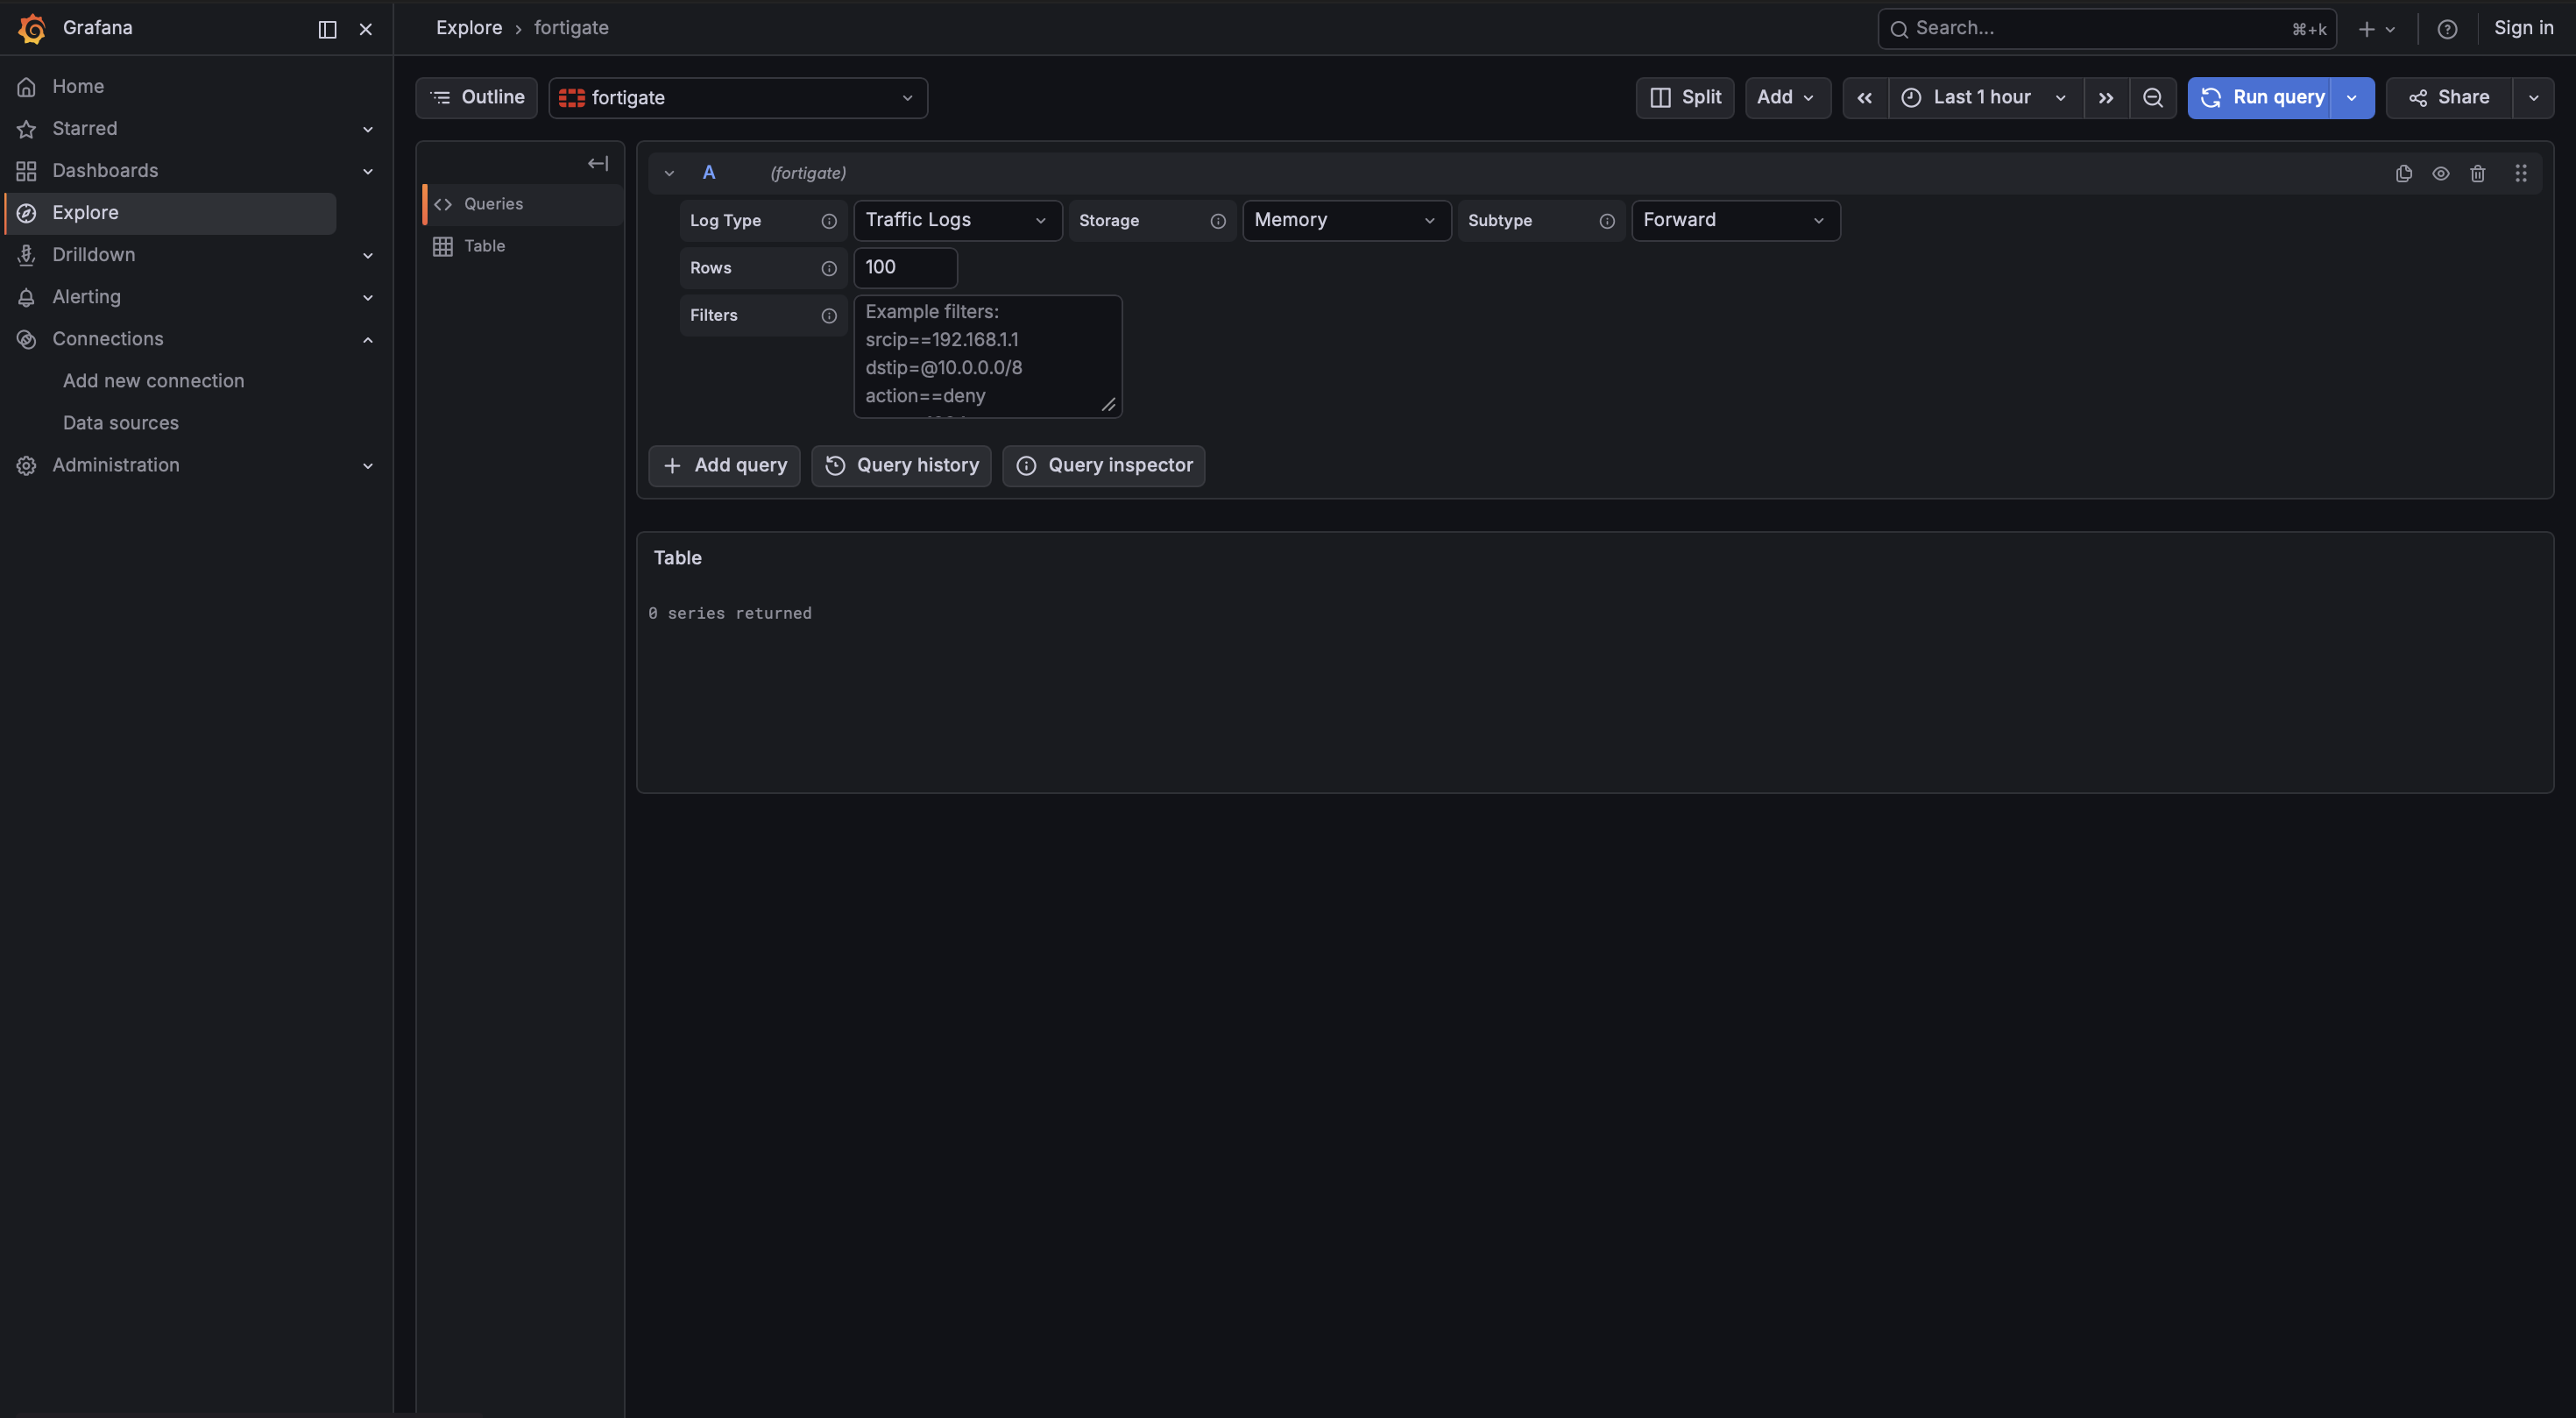
Query Editor

Installation
Requirements
- Grafana >= 12.3.0
- A FortiGate device with API access enabled
- An API Token for authentication
Obtaining API Credentials
Via GUI:
- Login to the FortiGate web interface
- Navigate to System > Administrators
- Click Create New > REST API Admin
- Configure the admin profile with appropriate permissions
- Click OK to generate the API token
- Copy the generated API token immediately (it won't be shown again)
Note: FortiGate API tokens do not expire unless a lifetime is specifically configured.
Install the Plugin
Install the plugin from the Grafana Plugin Catalog or using the Grafana CLI:
grafana cli plugins install crestdata-fortigate-datasource
After installation, restart the Grafana server for the plugin to be loaded.
Configure the Data Source
- In Grafana, navigate to Connections > Data Sources > Add data source
- Search for FortiGate and select it
- Fill in the required configuration fields:
| Name | Type | Required | Default | Description |
|---|---|---|---|---|
| FortiGate URL | String | Yes | - | Complete FortiGate URL with protocol and port (e.g., https://10.50.4.21:443 or https://fortigate.company.com:8443) |
| API Token | Secure String | Yes | - | Bearer token generated from FortiGate REST API Admin |
| Skip TLS Verify | Boolean | No | false | Skip SSL certificate verification for self-signed certificates |
| TLS CA Certificate | File | No | - | Provide the Certificate Authority (CA) certificate to verify the FortiGate server's SSL/TLS certificate |
| Timeout (seconds) | Integer | No | 30 | Request timeout in seconds. Range: 5-300 seconds |
- Click Save & Test. The health check will validate your credentials against the FortiGate API by calling testing endpoint.
Usage
Query Editor
Once the data source is configured, you can create panels using the query editor with the following parameters:
| Parameter | Type | Options | Default | Description |
|---|---|---|---|---|
| Event Type | Multi-select | Traffic, UTM, Event | Traffic | Log categories to query |
| Sub Type | Dropdown | For Traffic: forward, local, multicast, sniffer, fortiview, threat For UTM: stats, malicious-urls, trusted-urls For Event: vpn, user, router, wireless, wad, endpoint, ha, compliance-check, security-rating, fortiextender, connector, system | forward (Traffic) / stats (UTM) / system (Event) | Subtype for the Traffic, UTM, or Event log to query |
| Storage | Dropdown | Disk, Memory, FortiCloud | Disk (Traffic/Event) / Memory (UTM) | Storage location to query logs from. Note: UTM webfilter logs (malicious-urls, trusted-urls) are only available from Memory storage |
| Filter | Textbox | Supports operators: ==, !=, =@, !@, <=, <, >=, >, , (OR), & (AND) | - | Apply filtering on log data using multiple key-value conditions |
Filter Operators
The plugin supports advanced filtering with the following operators:
| Operator | Type | Description |
|---|---|---|
| == | Operator | Case-insensitive match with a pattern |
| != | Operator | Case-insensitive mismatch with a pattern |
| =@ | Operator | Checks if pattern exists within the value (case-insensitive) |
| !@ | Operator | Checks if pattern does not exist within the value |
| <= | Operator | Value is less than or equal to the given pattern |
| < | Operator | Value is less than the given pattern |
| >= | Operator | Value is greater than or equal to the given pattern |
| > | Operator | Value is greater than the given pattern |
| , | Logical | Logical OR between multiple filter conditions |
| & | Logical | Logical AND between multiple filter conditions |
Example filters:
srcip==10.40.1.242- Match specific source IPaction==deny&dstport>=8000- Denied actions with destination port >= 8000srcip=@10.40,dstip=@192.168- Source IP contains "10.40" OR destination IP contains "192.168"
Pagination and Data Fetching
The plugin automatically handles pagination for large datasets:
- Chunk size: 5000 records per request
- Session management: Maintains session ID across paginated requests
- Completion detection: Continues fetching until
ready: trueandcompleted: 100 - Filter changes: Regenerates session ID when filter criteria changes
Error Handling and Retry Strategy
Retries are performed only for transient failures:
- HTTP 429 (Too Many Requests) - Rate limit exceeded
- HTTP 502 (Bad Gateway) - Server acting as gateway received invalid response
- HTTP 503 (Service Unavailable) - Server temporarily unavailable
- HTTP 504 (Gateway Timeout) - Gateway timed out
- Network/connection-level errors
Retry configuration:
- Maximum retries: 3 attempts
- Initial backoff: 2 seconds
- Maximum backoff: 8 seconds
- Backoff pattern: Exponential (2s, 4s, 8s)
Non-retryable errors (HTTP 4xx such as 401, 403) are returned immediately with detailed error messages:
- 401 Unauthorized: Invalid API token or token format
- 403 Forbidden: API token lacks required permissions
- Connection Timeout: FortiGate device is unreachable or slow to respond
- TLS/SSL Errors: Certificate verification failed (enable "Skip TLS Verify" for self-signed certificates)
Pre-built Dashboards
The plugin ships three pre-built dashboards. All share these common default settings:
| Setting | Value |
|---|---|
| Default time range | Last 3 hours (now-3h to now) |
| Auto-refresh | Disabled |
| Datasource selection | Template variable (dropdown for selecting the instance) |
| Storage Type | Template variable (dropdown: Memory, Disk, FortiCloud) |
| Subtype | Template variable (dropdown: varies by log type) |
1. FortiGate Traffic Dashboard
High-level summary of all FortiGate Traffic, including total event count, traffic distribution by action, protocol, and service, and top source/destination IPs.
Features:
- Storage Type Selection: Dropdown to switch between Memory (real-time), Disk (historical), and FortiCloud storage
- Subtype Selection: Dropdown to filter by traffic subtype (forward, local, multicast, sniffer, fortiview, threat)
- Query Optimization: Uses query references to reduce API calls from 12 to 1 (92% reduction)
- Default Settings: Disk storage, Forward subtype
Panels:
- Top 10 Source IPs (Bar chart)
- Top 10 Destination IPs (Bar chart)
- Traffic by Action (Bar chart)
- Top 10 Services (Bar chart)
- Traffic by Protocol (Bar chart)
- Top 10 Source Ports (Bar chart)
- Top 10 Destination Ports (Bar chart)
- Traffic Logs (Table with filtering and sorting)
- Total Bytes Sent (Stat)
- Total Bytes Received (Stat)
- Top 10 IPs by Bytes Sent (Bar chart)
- Top 10 IPs by Bytes Received (Bar chart)
2. FortiGate Events Dashboard
Detailed analysis of FortiGate event logs across system, user, VPN, wireless, and router subtypes.
Panels:
- Events by Level (Bar chart) - Event count grouped by severity level
- Events by Status (Bar chart) - Event count grouped by status
- Events by Subtype (Horizontal bar chart) - Event count grouped by subtype
- Events by Action (Horizontal bar chart) - Event count grouped by action type
- Top Active Users (Horizontal bar chart) - Top 10 most active users
- System Event Logs (Table) - Detailed event log entries with key fields
3. FortiGate UTM Dashboard
Antivirus statistics and webfilter monitoring data for security threat analysis.
Panels:
- Scanned (Stat) - Total number of scanned items
- Clean (Stat) - Number of clean items detected
- Infected (Stat) - Number of infected items detected
- Suspicious (Stat) - Number of suspicious items detected
- Zero Hour (Stat) - Zero-hour threat detections
- File Hash External (Stat) - External file hash checks
- File Hash EMS (Stat) - EMS file hash checks
- File Hash Exempt (Stat) - Exempted file hash checks
- Inline Block (Stat) - Inline blocked items
- Webfilter - Malicious URLs (Table) - Monitoring of blocked malicious URLs detected by the webfilter
- Webfilter - Trusted URLs (Table) - Monitoring of allowed trusted URLs
Limitations and Recommendations
API Limitations:
Event time filtering: The API does not support filtering using the
eventtimefield. So, filtering is implemented using the_metadata.timestampfield instead. This may lead to slight differences between actual event occurrence time and filtered results.Rate limiting: API requests are limited to 100 requests per minute. The plugin implements automatic rate limiting compliance.
Chunk-based fetching: Data is fetched in smaller chunks (5000 records) due to large dataset sizes. If API rate limits are reached during fetching, the system must wait before making further requests. This can introduce delays in data retrieval, especially for large time ranges or high-volume data.
Recommended Grafana time ranges:
| Use Case | Recommended Range | Auto-refresh |
|---|---|---|
| Live monitoring | Last 1 hour to Last 6 hours | ON |
| Recent investigations | Last 12 hours to Last 1 day | ON with caution |
| Historical analysis | Last 2 days or more | OFF |
Support
For issues, questions, or feature requests, please open an issue in this repository.
Roadmap
See the open issues for a list of proposed features and known issues.
Contributing
Contributions are welcome! To get started with development:
cd crestdata-fortigate-datasource
Frontend
npm install
npm run dev        # development mode with watch
npm run build      # production build
Backend
mage -v            # build backend binaries
Tests
npm run test       # frontend tests (Jest)
npm run test:ci    # CI mode
go test ./…      # backend tests
Linting
npm run lint
npm run lint:fix
Local Grafana instance (Docker)
npm run server
E2E tests (Playwright)
npm run e2e
Before submitting a pull request:
- Run the linter and ensure all tests pass
- Validate the plugin using the Grafana Plugin Validator
- Ensure any changes to
plugin.jsonare intentional — a Grafana server restart is required after such changes
Authors and Acknowledgment
Developed by Crestdata.
License
This plugin is distributed under a custom End User License (EULA). See the LICENSE file for details.
References
Grafana Cloud Free
- Free tier: Limited to 3 users
- Paid plans: $55 / user / month above included usage
- Access to all Enterprise Plugins
- Fully managed service (not available to self-manage)
Self-hosted Grafana Enterprise
- Access to all Enterprise plugins
- All Grafana Enterprise features
- Self-manage on your own infrastructure
Install on Grafana Cloud
Plugins can be installed directly from within your Grafana instance or automated using the Cloud API or Terraform.
Learn more about plugin installationMarketplace plugins
This is a paid plugin developed by a marketplace partner. To purchase an entitlement, sign in first, then fill out the contact form.
Get this plugin
This is a paid for plugin developed by a marketplace partner. To purchase entitlement please fill out the contact us form.
What to expect:
- Grafana Labs will reach out to discuss your needs
- Payment will be taken by Grafana Labs
- Once purchased the plugin will be available for you to install (cloud) or a signed version will be provided (on-premise)
Thank you! We will be in touch.
For more information, visit the docs on plugin installation.
Installing on a local Grafana:
For local instances, plugins are installed and updated via a simple CLI command. Plugins are not updated automatically, however you will be notified when updates are available right within your Grafana.
1. Install the Data Source
Use the grafana-cli tool to install FortiGate from the commandline:
grafana-cli plugins install The plugin will be installed into your grafana plugins directory; the default is /var/lib/grafana/plugins. More information on the cli tool.
Alternatively, you can manually download the .zip file for your architecture below and unpack it into your grafana plugins directory.
Alternatively, you can manually download the .zip file and unpack it into your grafana plugins directory.
2. Configure the Data Source
Accessed from the Grafana main menu, newly installed data sources can be added immediately within the Data Sources section.
Next, click the Add data source button in the upper right. The data source will be available for selection in the Type select box.
To see a list of installed data sources, click the Plugins item in the main menu. Both core data sources and installed data sources will appear.
Changelog
1.0.6
- FortiOS does not filter by the subtype URL path segment so inject subtype==<value> explicitly as a query parameter to guarantee only the requested subtype is returned.
1.0.5
- Updated license link
1.0.4
- Added public link for screenshots present in Readme.
1.0.3
- Aligned the version across plugin.json, CHANGELOG, and the release tag
1.0.2
- Updated EULA in license
- Updated Dashboards to reference the existing panels
1.0.1
- Updated backend logger
- Updated TLS verification logic
1.0.0
Initial release.