Plugins 〉Dell EMC PowerScale


Dell EMC PowerScale


Dell EMC PowerScale Data Source Plugin for Grafana
Description
The Dell EMC PowerScale DataSource Plugin is a Grafana backend datasource plugin that enables on-demand querying and visualization of Dell EMC PowerScale (formerly Isilon) cluster metrics, storage statistics, and system events inside Grafana panels.
Dell EMC PowerScale is a scale-out network-attached storage (NAS) platform that provides high-performance, scalable storage for unstructured data. The plugin connects to the OneFS API to retrieve real-time and historical metrics including cluster health, node performance, protocol statistics, storage capacity, quotas, NFS exports, and system events.
Features
- Query and visualize PowerScale cluster metrics directly within Grafana
- Support for multiple data categories:
- Statistics: Real-time and historical cluster, node, and protocol performance metrics
- Cluster Configuration: Cluster name, OneFS version, and system settings
- Storage Pools: Tier capacity, usage, and protection status
- Node Pools: Per-node-pool capacity and disk allocation
- Quotas: Per-path quota usage, limits, and enforcement status
- NFS Exports: Export configurations and mount paths
- Events: System alerts and event groups filtered by severity
- Licenses: Installed feature licenses and expiration status
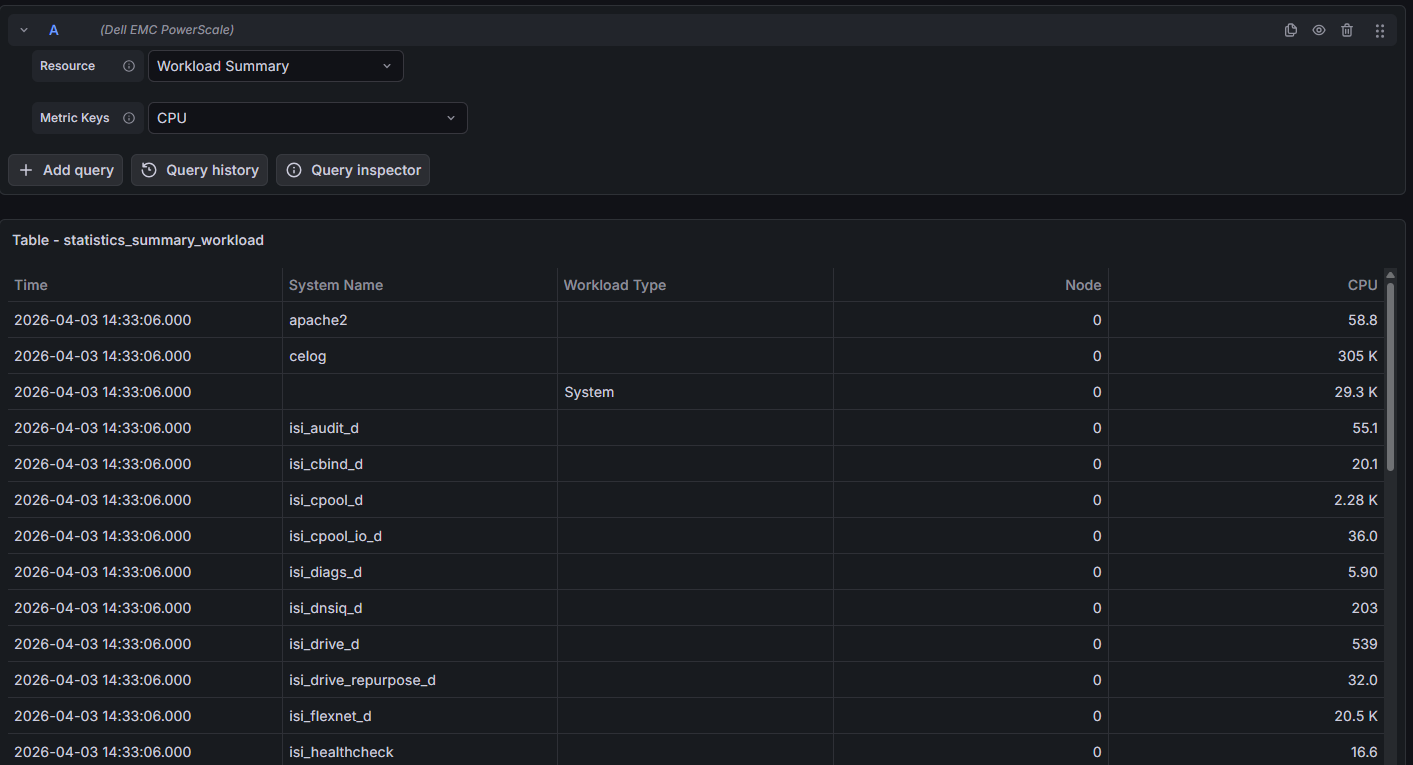
- Workload Summary: Per-workload CPU, throughput, latency, and I/O statistics
- Time-series support for historical statistics with configurable intervals
- Node-specific filtering for detailed per-node metrics
- Built-in retry logic with exponential backoff for transient failures
- TLS support with optional CA certificate verification
- Automatic session management with the OneFS API
Compatibility
| Component | Version / Detail |
|---|---|
| Grafana | >= 12.0.0 |
| OneFS API | Latest (auto-detected) |
| Authentication | Session Auth |
Visuals
Onboarding
Query Examples

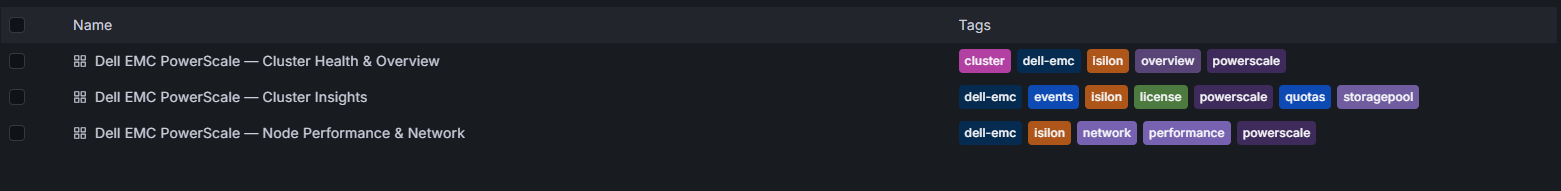
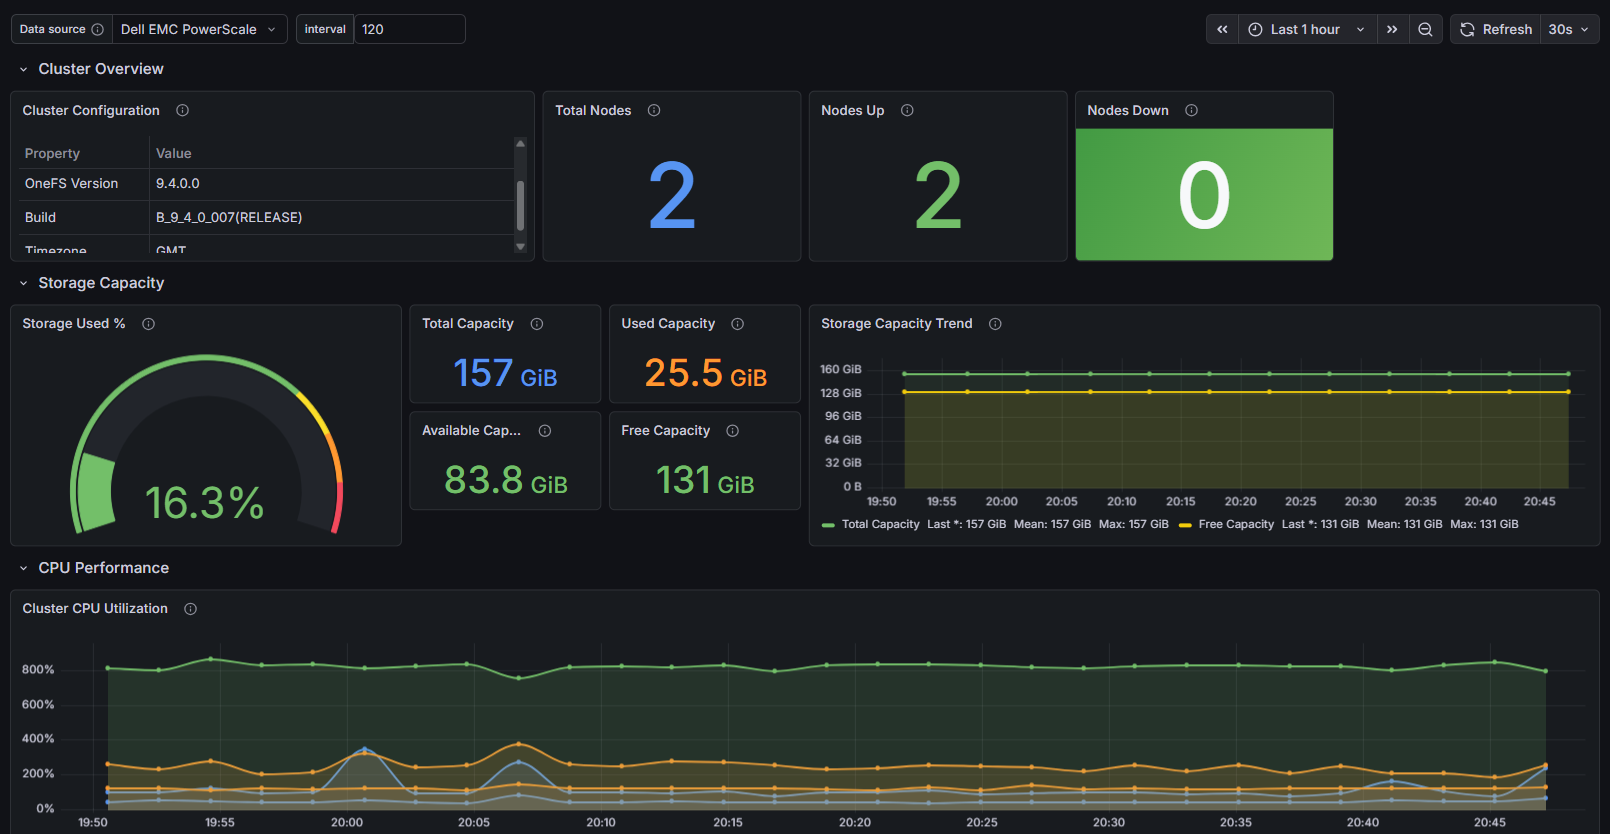
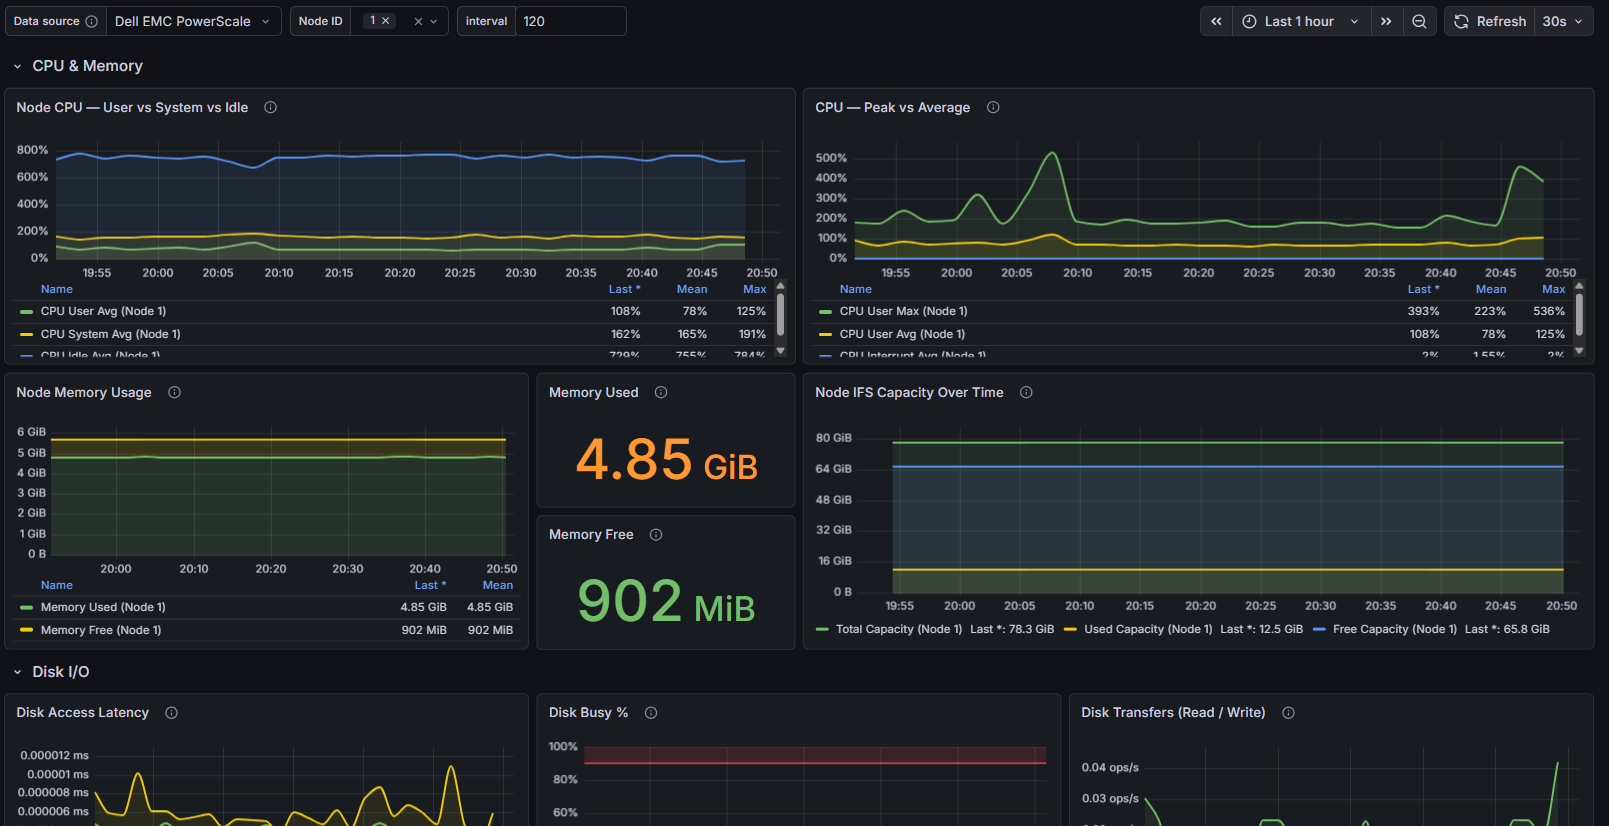
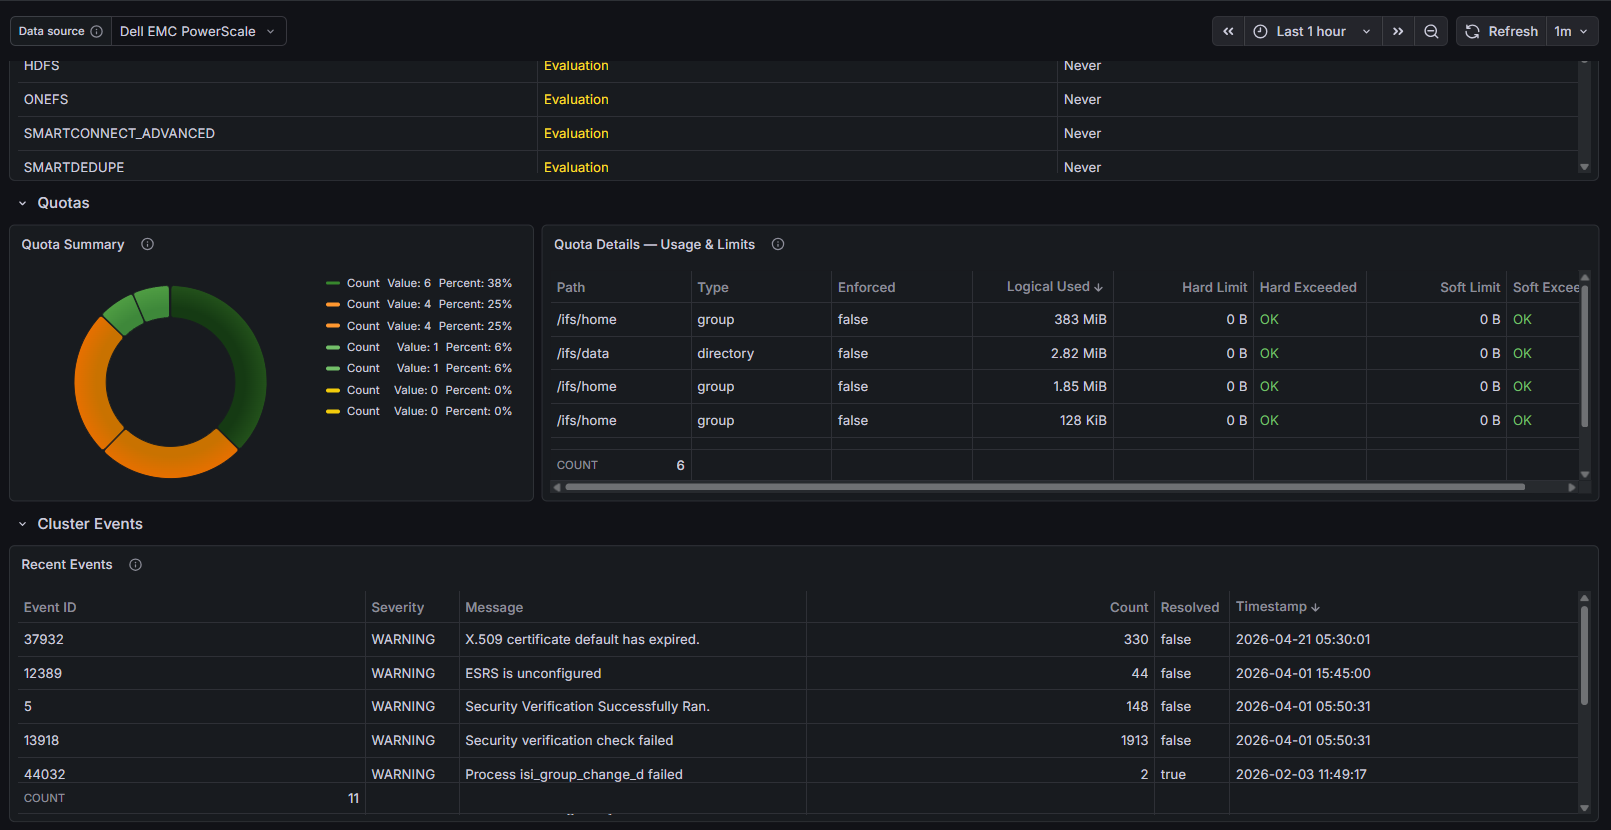
Added Dashbords
Installation
Requirements
- Grafana >= 12.0.0
- A Dell EMC PowerScale cluster with API access enabled
- OneFS credentials (username and password)
- Network connectivity to the PowerScale cluster management interface
Obtain OneFS Credentials
- Login to the PowerScale Web UI or CLI.
- Navigate to Access > Membership & Roles (or use the CLI).
- Create or identify a user with appropriate permissions for the Platform API.
- Ensure the user has access to at least the following services:
platform.
Install the Plugin
Install the plugin from the Grafana Plugin Catalog or using the Grafana CLI:
grafana cli plugins install crestdata-dellemcpowerscale-datasource
After installation, restart the Grafana server for the plugin to be loaded.
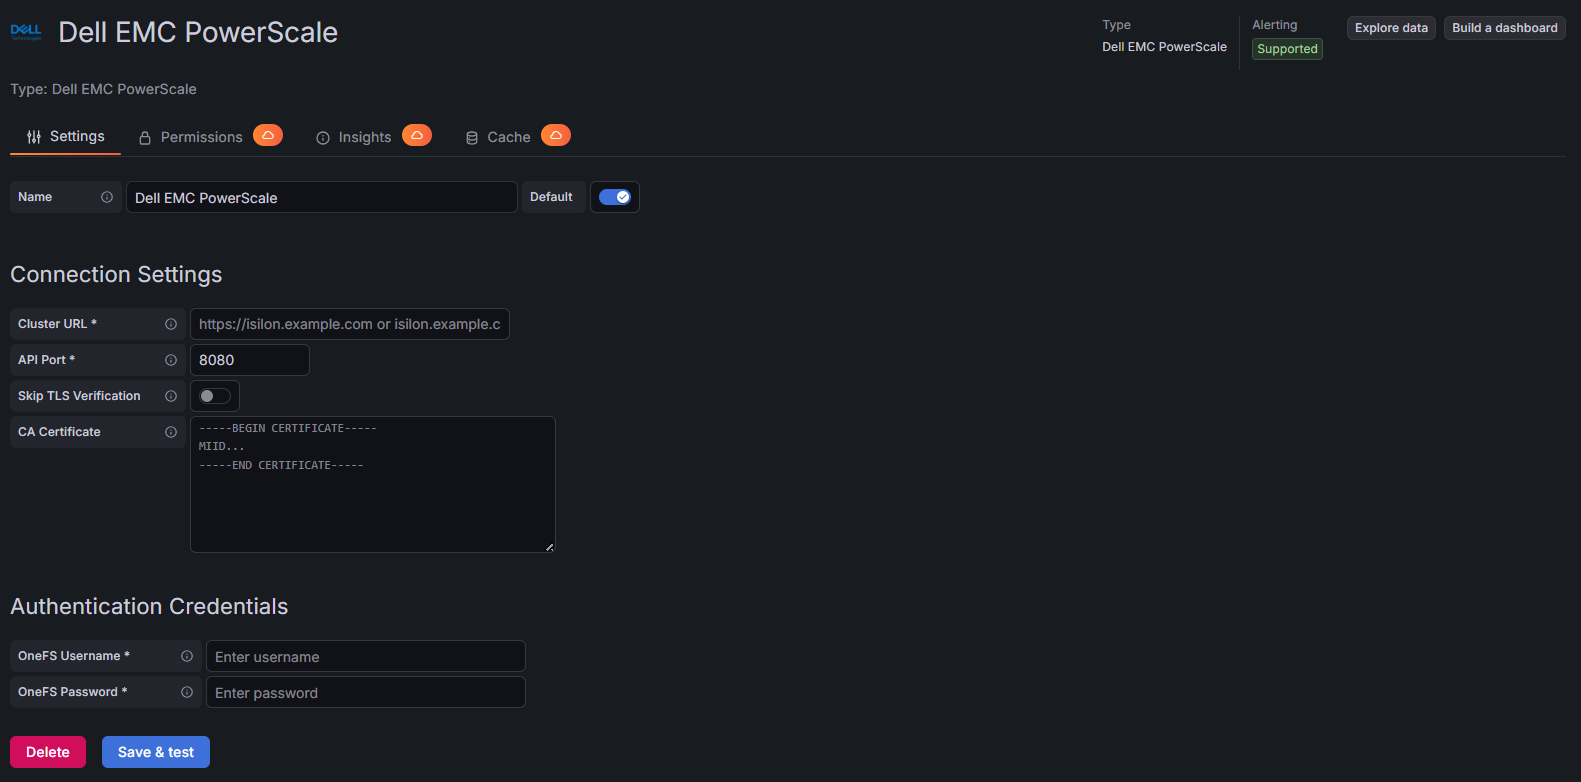
Configure the Data Source
- In Grafana, navigate to Connections > Data Sources > Add data source.
- Search for Dell EMC PowerScale and select it.
- Fill in the required configuration fields:
| Name | Type | Required | Description |
|---|---|---|---|
| URL | String | Yes | The PowerScale cluster URL (e.g., https://cluster.example.com) |
| Port | Number | No | The OneFS API port (default: 8080) |
| Username | String | Yes | The OneFS username for authentication |
| Password | Secure String | Yes | The OneFS password for authentication |
| TLS Skip Verify | Boolean | No | Skip TLS certificate verification (not recommended for production) |
| CA Certificate | Secure String | No | Custom CA certificate PEM content (required if TLS Skip Verify is false) |
- Click Save & Test. The health check will validate your credentials against the PowerScale API.
TLS Configuration
For secure production environments:
- TLS with CA Certificate (Recommended): Leave "TLS Skip Verify" unchecked and provide a valid CA certificate in the "CA Certificate" field.
- TLS Skip Verify: Only enable this for trusted environments. This skips TLS certificate validation.
Usage
Query Editor
Once the data source is configured, you can create panels using the query editor with the following parameters:
| Parameter | Type | Options | Default | Description |
|---|---|---|---|---|
| Resource | Dropdown | Statistics, Workload Summary, Cluster Config, Storage Pools, Node Pools, Quota Summary, Quotas, NFS Exports, NFS Export Stats, Events, Licenses | Statistics | Select the data category to query |
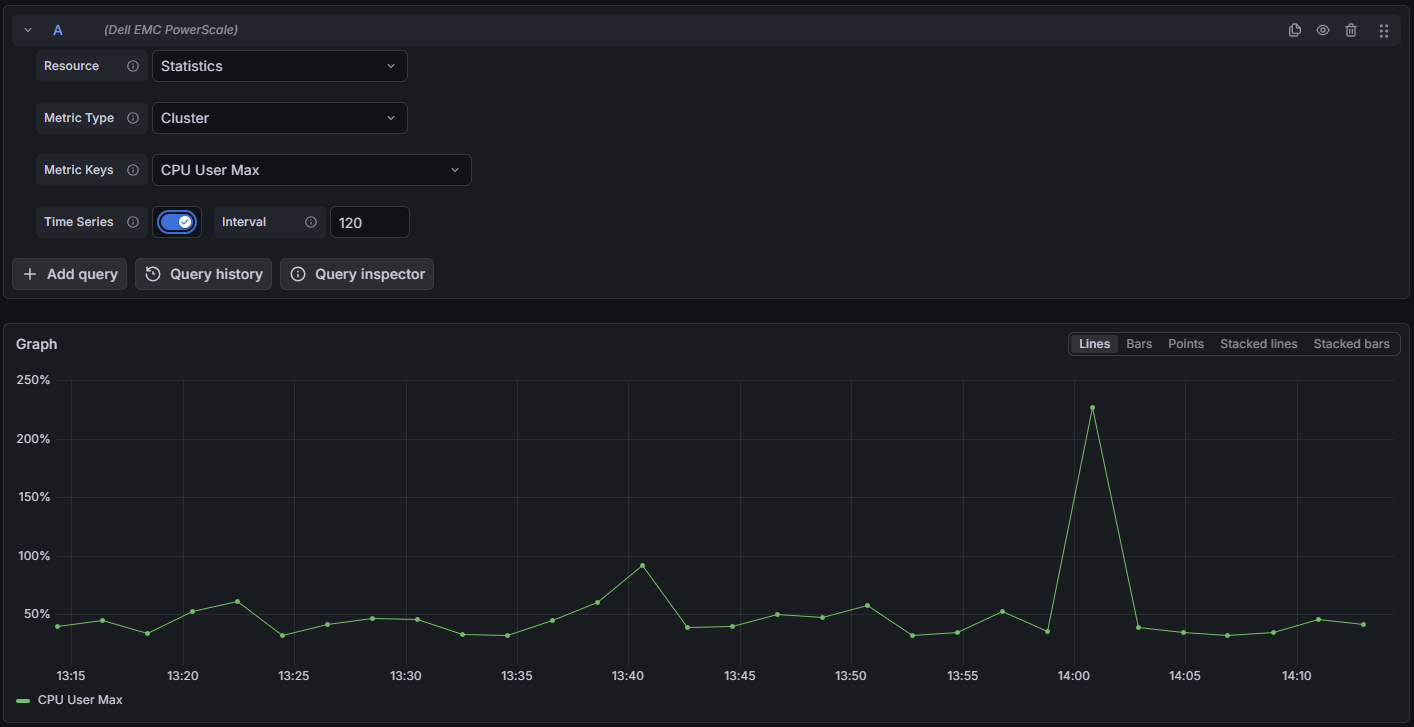
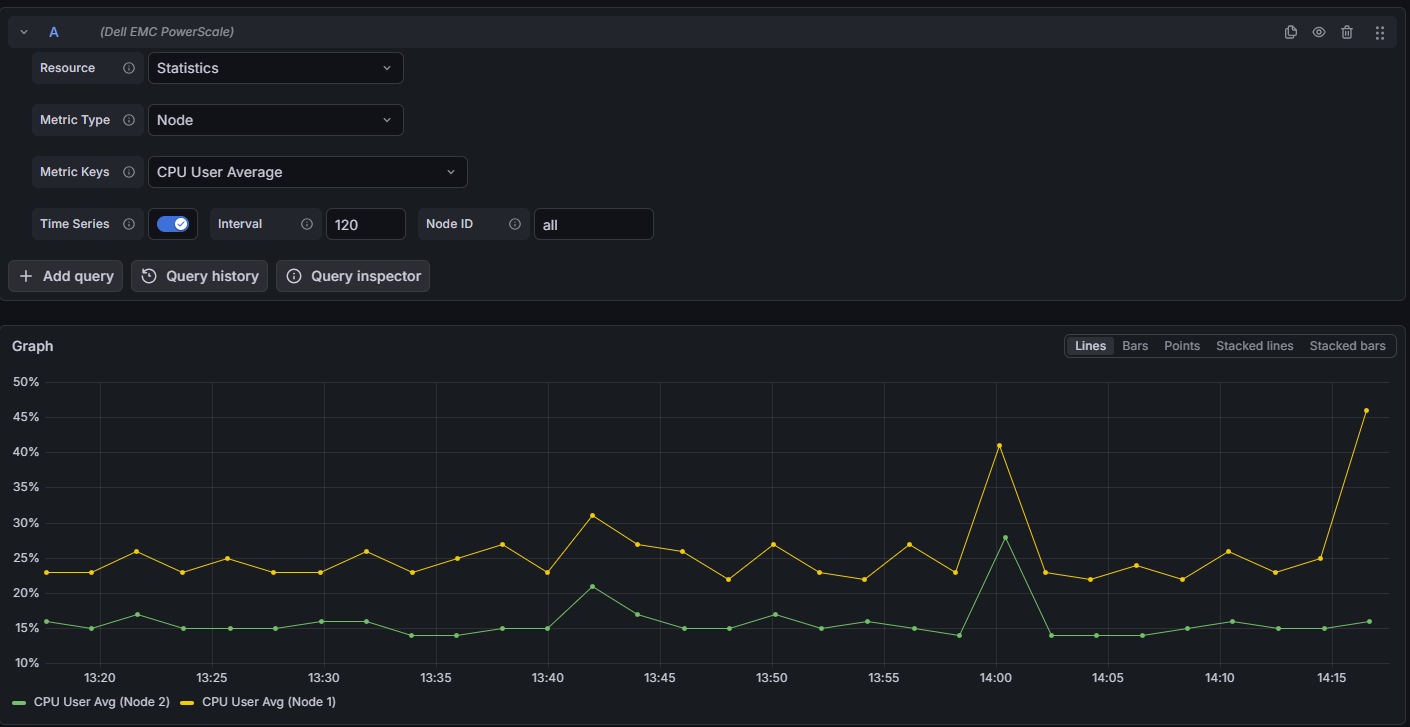
| Metric Type | Dropdown | Cluster, Node, Protocol | Cluster | Select metric aggregation level (for Statistics resource) |
| Metric Keys | Multi-select | Depends on metric type | Varies | Specific metrics to retrieve (e.g., CPU, Network, Storage) |
| Use Time Series | Boolean | true, false | false | Enable historical time-series data (Statistics only) |
| Interval | Number | Seconds | 120 | Sampling interval for time-series data (seconds) |
| Node ID | String | Node numbers (comma-separated) | All nodes | Filter to specific nodes (Node/Protocol metric types only) |
| Export ID | Number | Export ID | - | NFS Export ID (for NFS Export Stats resource) |
| Severity Filter | Multi-select | Emergency, Critical, Error, Warning, Notice, Information | All | Filter events by severity (Events resource only) |
Available Metric Categories
Cluster Metrics
- CPU: User/system utilization, idle time
- Network: Bytes/packets in/out rates
- Storage: IFS filesystem capacity, usage, SSD statistics
- Health: Node count (total, up, down)
Node Metrics
- CPU: Per-node CPU utilization
- Network: Per-node network throughput and errors
- Storage: Per-node capacity
- Memory: RAM usage
- Cache: L2 (SSD) and L3 (RAM) cache hits/misses
- Disk: Access latency, busy percentage, queue depth, transfer rates
Protocol Metrics
- NFS: NFSv3, NFSv4, NFS RDMA operations
- SMB: SMB1, SMB2/SMB3 operations
- Other: NLM, FTP, HTTP, SyncIQ, PAPI, HDFS, S3 operations
- Client Stats: Active and connected client counts
Time Series Handling
The Statistics resource supports time-series queries for historical data:
- Enable Use Time Series to retrieve historical metrics
- Configure the Interval parameter (in seconds) to control data granularity
- Default interval is 120 seconds
- Time range is automatically passed from the Grafana time picker
Error Handling and Retry Strategy
Retries are performed only for transient failures:
- HTTP 429 (rate limited)
- HTTP 5xx responses (500–599)
- Network/connection-level errors
- Errors while reading the response body
- Session authentication failures (with automatic re-authentication)
Max retry attempts: 3, with exponential backoff (base delay: 3 seconds).
Non-retryable: HTTP 4xx errors (e.g., 401, 403) are returned immediately.
Resources Reference
| Resource | Description | Supports Time Series |
|---|---|---|
| Statistics | Real-time and historical cluster, node, and protocol metrics | Yes |
| Workload Summary | Per-workload CPU, throughput, latency, and I/O statistics | No |
| Cluster Config | Cluster name, OneFS version, timezone settings | No |
| Storage Pools | Tier capacity, usage, and protection status | No |
| Node Pools | Per-node-pool capacity and disk allocation | No |
| Quota Summary | Quota counts grouped by type | No |
| Quotas | Per-path quota usage, limits, and enforcement | No |
| NFS Exports | Export IDs and mount paths | No |
| NFS Export Stats | Detailed NFS export configuration by Export ID | No |
| Events | System alerts filtered by severity | No |
| Licenses | Installed feature licenses and expiration | No |
Limitations and Recommendations
API Considerations:
- The plugin uses the OneFS Platform API (auto-detects latest version)
- Session authentication is maintained and automatically refreshed
Performance tips:
- Use higher interval values (e.g., 300s or more) for long time ranges
- Use Node ID filtering to reduce data volume for large clusters
Support
For issues, questions, or feature requests, please open an issue in this repository.
Roadmap
See the open issues for a list of proposed features and known issues.
Contributing
Contributions are welcome! To get started with development:
cd crestdata-dellemcpowerscale-datasource
Frontend
npm install
npm run dev        # development mode with watch
npm run build      # production build
Backend
mage -v            # build backend binaries
Tests
npm run test       # frontend tests (Jest)
npm run test:ci    # CI mode
go test ./…      # backend tests
Linting
npm run lint
npm run lint:fix
Local Grafana instance (Docker)
npm run server
E2E tests (Playwright)
npm run e2e
Before submitting a pull request:
- Run the linter and ensure all tests pass.
- Validate the plugin using the Grafana Plugin Validator.
- Ensure any changes to
plugin.jsonare intentional — a Grafana server restart is required after such changes.
Authors and Acknowledgment
Developed by Crest Data.
License
This plugin is distributed under EULA License. See the LICENSE file for details.
References
Grafana Cloud Free
- Free tier: Limited to 3 users
- Paid plans: $55 / user / month above included usage
- Access to all Enterprise Plugins
- Fully managed service (not available to self-manage)
Self-hosted Grafana Enterprise
- Access to all Enterprise plugins
- All Grafana Enterprise features
- Self-manage on your own infrastructure
Install on Grafana Cloud
Plugins can be installed directly from within your Grafana instance or automated using the Cloud API or Terraform.
Learn more about plugin installationMarketplace plugins
This is a paid plugin developed by a marketplace partner. To purchase an entitlement, sign in first, then fill out the contact form.
Get this plugin
This is a paid for plugin developed by a marketplace partner. To purchase entitlement please fill out the contact us form.
What to expect:
- Grafana Labs will reach out to discuss your needs
- Payment will be taken by Grafana Labs
- Once purchased the plugin will be available for you to install (cloud) or a signed version will be provided (on-premise)
Thank you! We will be in touch.
For more information, visit the docs on plugin installation.
Installing on a local Grafana:
For local instances, plugins are installed and updated via a simple CLI command. Plugins are not updated automatically, however you will be notified when updates are available right within your Grafana.
1. Install the Data Source
Use the grafana-cli tool to install Dell EMC PowerScale from the commandline:
grafana-cli plugins install The plugin will be installed into your grafana plugins directory; the default is /var/lib/grafana/plugins. More information on the cli tool.
Alternatively, you can manually download the .zip file for your architecture below and unpack it into your grafana plugins directory.
Alternatively, you can manually download the .zip file and unpack it into your grafana plugins directory.
2. Configure the Data Source
Accessed from the Grafana main menu, newly installed data sources can be added immediately within the Data Sources section.
Next, click the Add data source button in the upper right. The data source will be available for selection in the Type select box.
To see a list of installed data sources, click the Plugins item in the main menu. Both core data sources and installed data sources will appear.
Changelog
1.0.5
- Added public link for license.
1.0.4
- Added public link for screenshots present in Readme.
1.0.3
- Aligned the version across plugin.json, CHANGELOG, and the release tag
1.0.2
- Updated EULA in license
- Updated Dashboards to reference the existing panels
1.0.1
- Updated backend logger
- Updated TLS verification logic
1.0.0
Initial release.