Cisco Meraki Data Source Plugin for Grafana
Description
The Cisco Meraki DataSource Plugin is a Grafana backend datasource plugin that enables on-demand querying and visualization of Cisco Meraki device metrics, network performance data, and event logs through interactive dashboards.
Cisco Meraki is a cloud-managed IT solution that provides wireless, switching, security, SD-WAN, mobile device management, and security cameras. The plugin connects to the Cisco Meraki Dashboard API v1 to surface organization, network, and device telemetry inside Grafana.
Features
- Query and visualize 11+ Cisco Meraki Dashboard API endpoints directly in Grafana
- Live device availability snapshot and historical availability change history (time-series)
- Network and security event logs
- Wireless statistics: client count history, latency stats, and connection stats (organization-scope or network-scope)
- Switch port statuses, appliance uplink statuses, and site-to-site VPN stats
- Dynamic dropdowns for Network and Device Serial populated from the Meraki API
- Configurable Base URL for regional endpoints (Canada, China, India, US FedRAMP)
- Rate-limit handling with
Retry-Afterheader support. - RFC 5988 Link-header based pagination for all paginated endpoints
- Per-endpoint time-range validation against Meraki's documented maximum windows
- Bundled overview dashboard for immediate insight
Compatibility
| Component | Version / Detail |
|---|---|
| Grafana | >= 12.0.0 |
| Cisco Meraki Dashboard API | v1 |
| Authentication | API Key |
Visuals
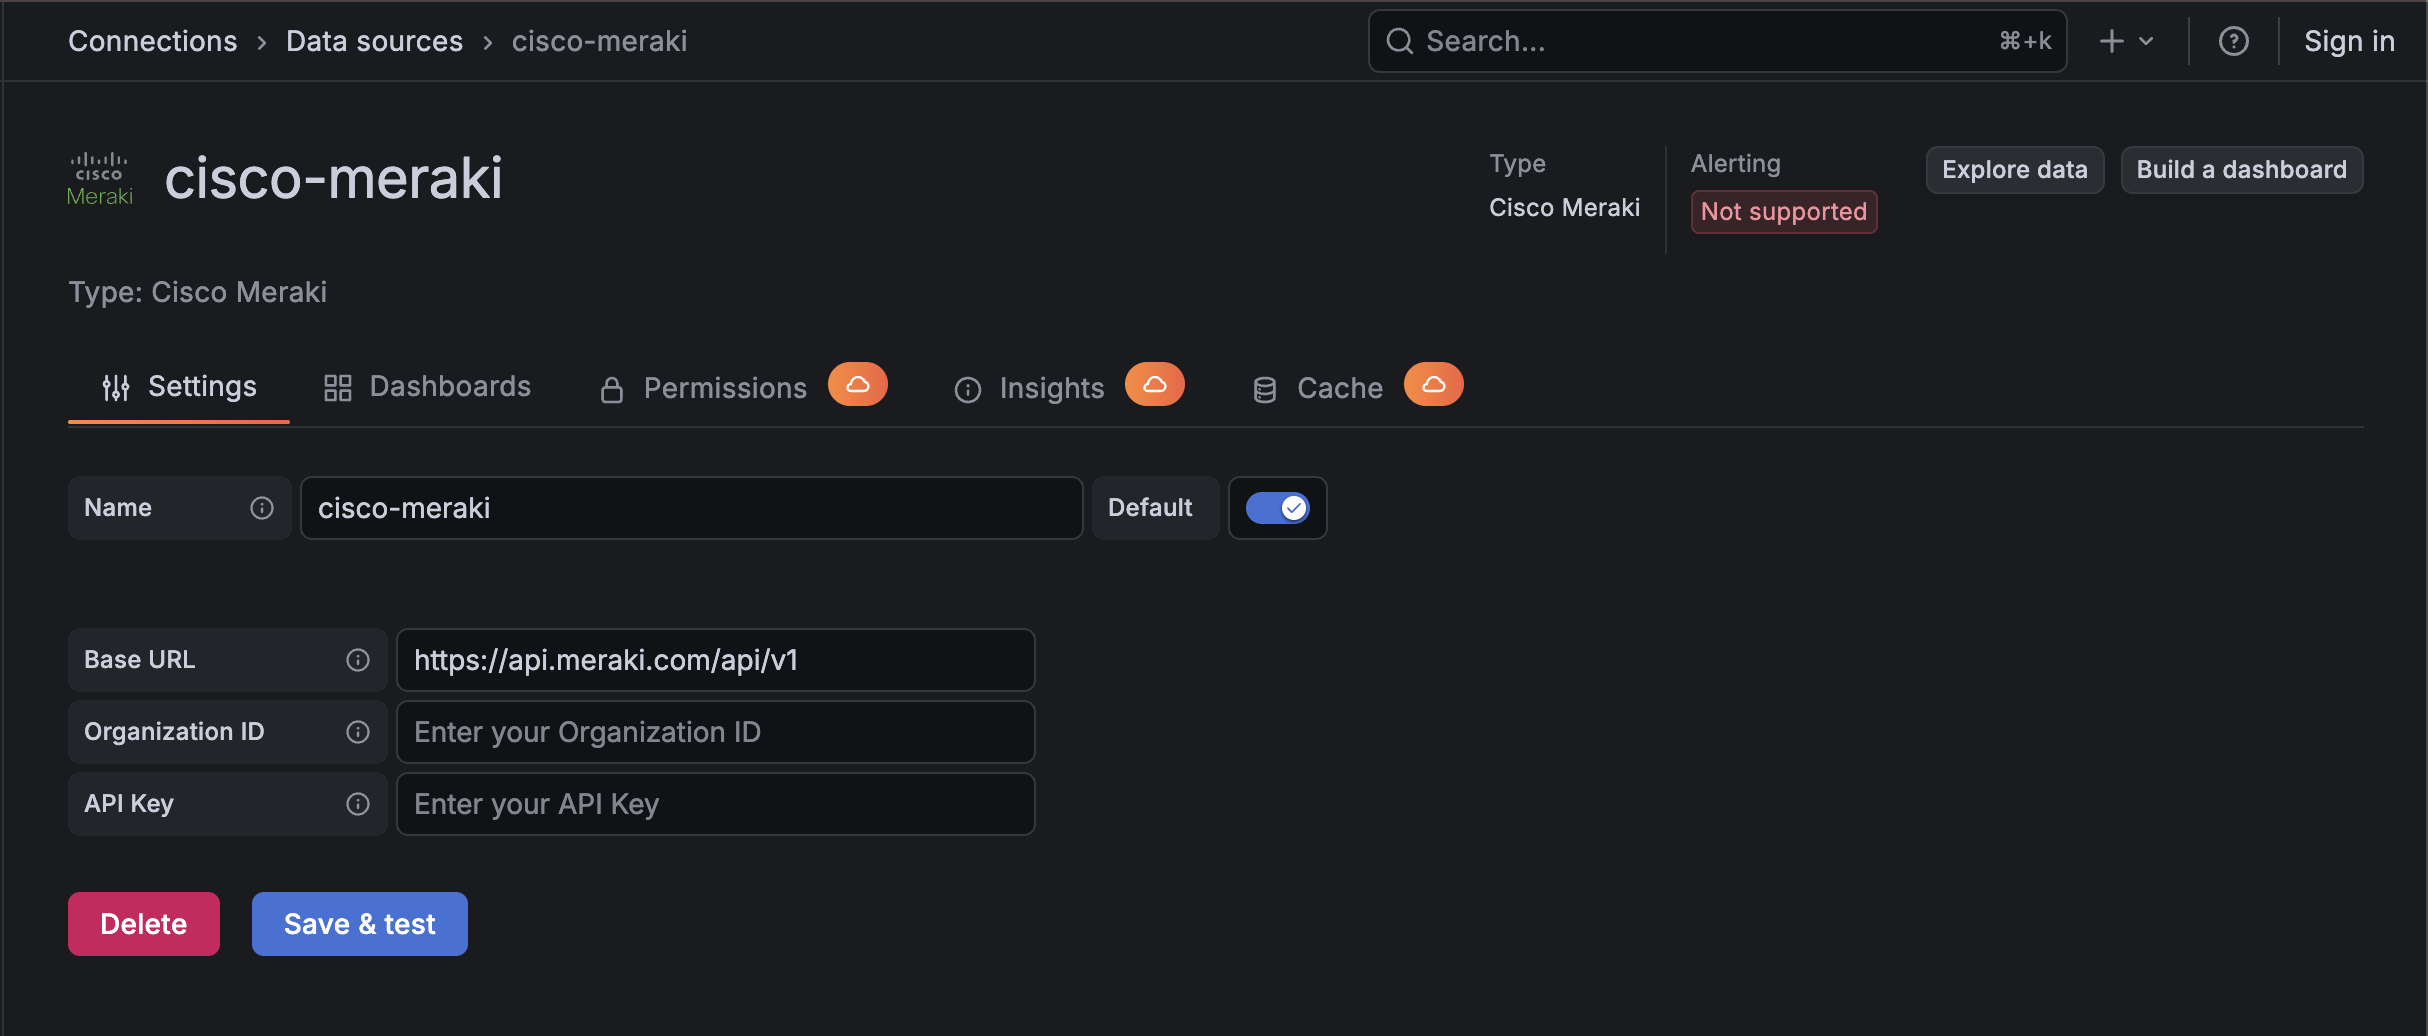
Configuration Editor
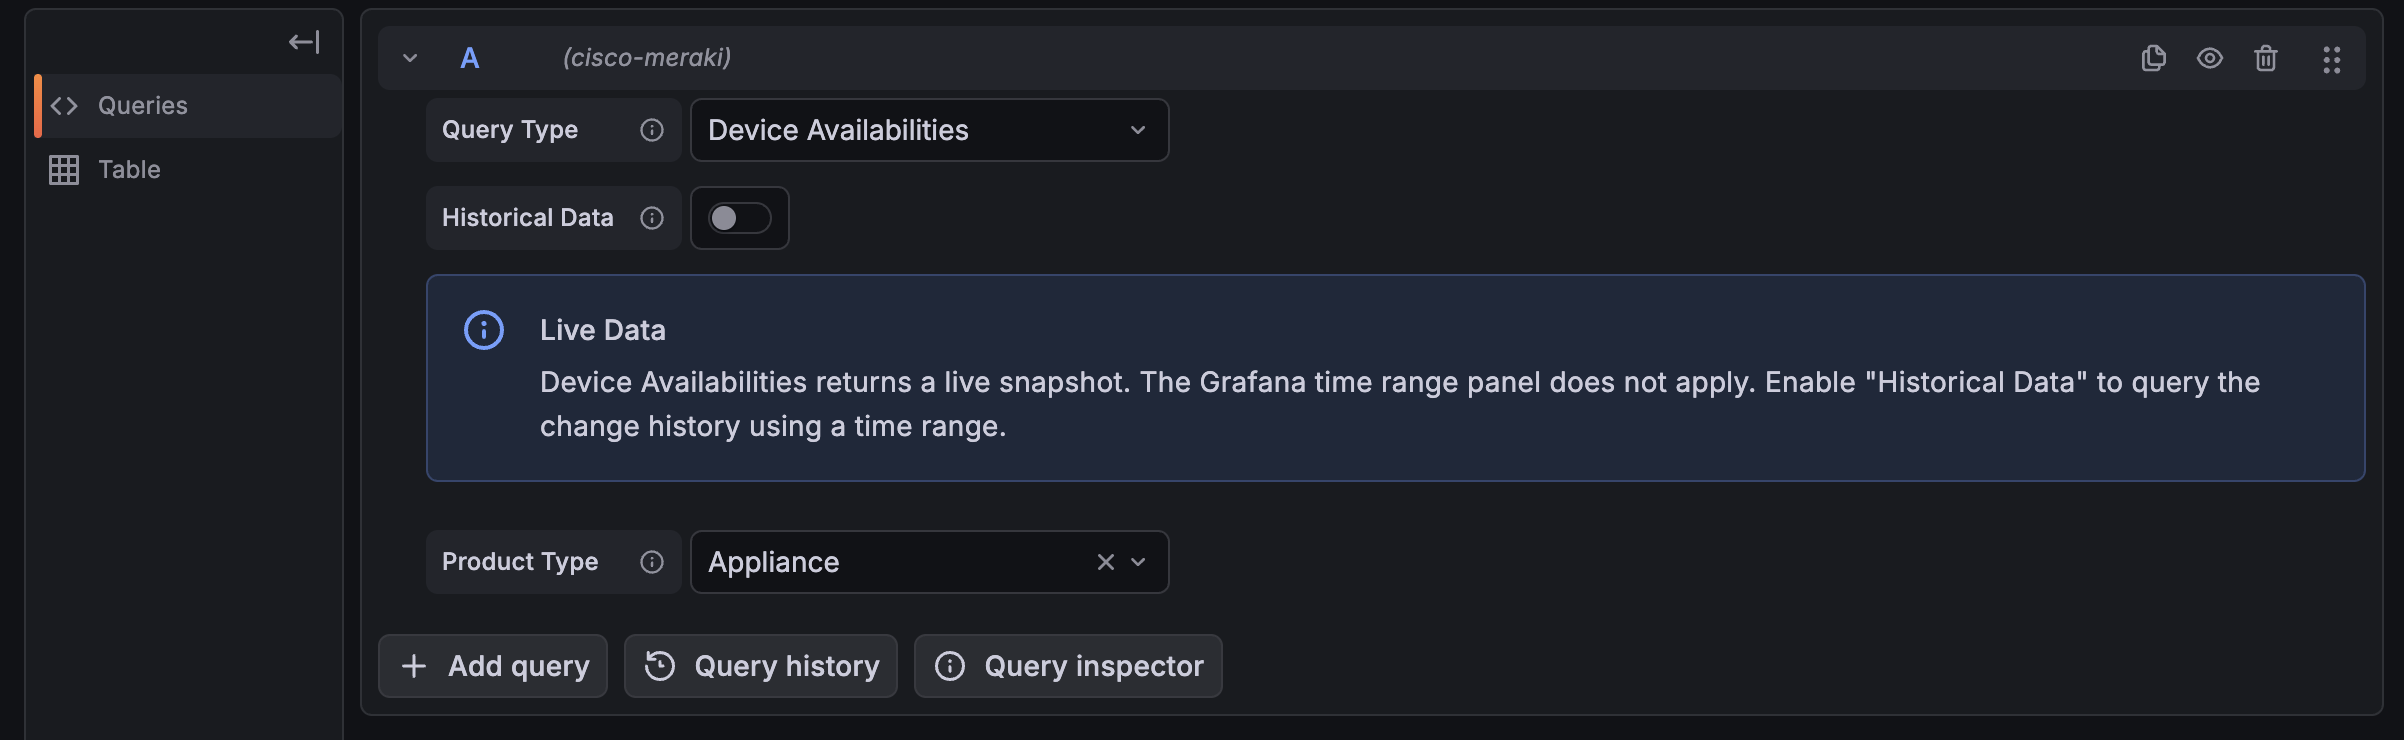
Query Editor
Installation
Requirements
- Grafana >= 12.0.0
- A Cisco Meraki Dashboard API key with read access to the target organization
- The Organization ID for the Meraki organization to query
Obtaining an API Key
- Sign in to the Cisco Meraki Dashboard.
- Navigate to My Profile (top-right user menu).
- Scroll to API access and click Generate new API key.
- Copy the API key and store it securely — it is shown only once.
- Note your Organization ID from Organization > Settings, or via the API:
GET /organizations.
Install the Plugin
Install the plugin from the Grafana Plugin Catalog or using the Grafana CLI:
grafana cli plugins install crestdata-ciscomeraki-datasource
After installation, restart the Grafana server for the plugin to be loaded.
Configure the Data Source
- In Grafana, navigate to Connections > Data Sources > Add data source.
- Search for Cisco Meraki and select it.
- Fill in the configuration fields:
| Name | Type | Required | Description |
|---|---|---|---|
| Base URL | String | Yes | The Meraki API base URL. Defaults to https://api.meraki.com/api/v1. Update for regional endpoints when applicable. |
| Organization ID | String | Yes | Your Meraki organization ID |
| API Key | Secure String | Yes | Your Meraki Dashboard API key (stored securely) |
For organizations hosted in Canada, China, India, or US FedRAMP, replace the Base URL with the appropriate regional API base URI as documented by Meraki.
- Click Save & Test. The health check will validate your credentials against the Meraki API.
Usage
Query Editor
The query editor exposes the following fields. Field visibility and required/optional behavior depends on the selected query type.
| Parameter | Type | Source | Description |
|---|---|---|---|
| Query Type | Dropdown | Static | The Meraki endpoint to query |
| Network | Dropdown | /organizations/{orgId}/networks |
Network selector. Internally uses network ID; user sees network name |
| Device Serial | Dropdown | /organizations/{orgId}/devices |
Device selector. Internally uses serial; user sees device name |
| Product Type | Dropdown | Static (wireless, appliance, switch, etc.) | Optional filter; omitted from the API call when not selected |
| Historical Data | Toggle | — | Device Availabilities only — switches to availability change history |
Validation
- Required fields show inline validation errors when missing (e.g., Network for Network Events, Device Serial for Device Clients).
- Time range validation warns when the selected range exceeds the endpoint's maximum window.
- Optional filters are omitted from API calls when not selected, avoiding unnecessary parameter overhead.
Supported Query Types
| Query Type | Description | Max Time Range |
|---|---|---|
| Device Availabilities | Live device status snapshot (online/offline/alerting/dormant) | N/A (live) |
| Device Availability History | Time-series of availability status changes | Up to 1 year |
| Network Events | 802.11, DHCP, VPN, and other network events | N/A |
| Security Events | IDS/IPS alerts and security appliance events | Up to 31 days |
| Network Clients | Clients connected to a network | Up to 31 days |
| Device Clients | Clients connected to a specific device | Up to 1 day |
| Wireless Latency Stats | Per-traffic-class latency statistics (org-scope or network-scope) | Up to 180 days |
| Wireless Connection Stats | Association, auth, DHCP, DNS success counts (org or network scope) | Up to 180 days |
| Wireless Client Count History | Historical wireless client count time series | Up to 31 days |
| Switch Port Statuses | Port status, speed, duplex, and usage per switch | N/A (live) |
| Appliance Uplink Statuses | WAN uplink status, IP, ISP per appliance | N/A (live) |
| VPN Stats | Site-to-site VPN latency, loss, jitter, and MOS | Up to 31 days |
Time Range Handling
- The plugin uses Grafana's panel time range for all time-bounded endpoints.
- Per-endpoint maximum windows are enforced client-side; ranges exceeding the limit produce an inline error before the API call is made.
- Live endpoints (Device Availabilities, Switch Port Statuses, Appliance Uplink Statuses) ignore the time range and return current state.
Error Handling and Retry Strategy
The plugin respects Meraki's published rate limits (10 requests/second per organization).
- HTTP 429 (rate limited): the
Retry-Afterheader is honored before retrying. - HTTP 5xx responses: retried with exponential backoff (up to 3 attempts).
- HTTP 4xx errors (except 429): returned immediately without retry.
- All paginated endpoints follow RFC 5988 Link headers until the last page is reached.
Pre-built Dashboards
The plugin ships with a Cisco Meraki Overview dashboard. It includes:
| Section | Panels |
|---|---|
| Device Availability | Device Availabilities table (live) |
| Network Events | Network Events table (filtered by network_id template variable) |
| Security Events | Security Events table |
| Wireless | Wireless Client Count History (time-series) |
| Infrastructure | Switch Port Statuses table, Appliance Uplink Statuses table |
| VPN | VPN Stats table |
The dashboard exposes a network_id template variable for filtering network-scoped panels and a DS_CISCO_MERAKI datasource selector.
Limitations and Recommendations
- Rate limits: 10 requests/second per organization. Dashboards with many panels and short refresh intervals can quickly hit this limit.
- Pagination: Endpoints returning large result sets paginate via Link headers; queries spanning long time ranges may take several seconds.
- Recommended refresh interval: Off, or no faster than 1 minute for dashboards with many panels.
- Historical availability: The change-history endpoint is most useful with longer ranges (hours to days). Short ranges may return empty if no status transitions occurred.
Support
For issues, questions, or feature requests, please open an issue in this repository.
Roadmap
See the open issues for a list of proposed features and known issues.
Contributing
Contributions are welcome! To get started with development:
cd crestdata-ciscomeraki-datasource

# Frontend
npm install
npm run dev        # development mode with watch
npm run build      # production build

# Backend
mage -v            # build backend binaries

# Tests
npm run test       # frontend tests (Jest)
npm run test:ci    # CI mode
go test ./...      # backend tests

# Linting
npm run lint
npm run lint:fix

# Local Grafana instance (Docker)
npm run server

# E2E tests (Playwright)
npm run e2e
Before submitting a pull request:
- Run the linter and ensure all tests pass.
- Validate the plugin using the Grafana Plugin Validator.
- Ensure any changes to
plugin.jsonare intentional — a Grafana server restart is required after such changes.
Authors and Acknowledgment
Developed by Crestdata.
License
This plugin is distributed under the EULA LICENSE.
References
Plugin Insights
Quality scores for version 1.0.3
- Status: PassedSecurity
All checks passed
- Status: PassedMaintenance
All checks passed
- Status: PassedDocumentation
All checks passed
- Version
- 1.0.3
- Dependencies
- Grafana >=12.0.0
- Developer
- crestdata
- Last Updated
- June 1, 2026