
Akamai Data Source Plugin for Grafana
A Grafana backend datasource plugin that queries the Akamai SIEM Integration API for WAF/Bot/Client-Reputation security events and the Akamai Reporting API v2 for CDN traffic metrics. Authentication uses EdgeGrid HMAC-SHA-256, the standard scheme for all Akamai APIs.
Features
- Queries Akamai's SIEM Integration API (
/siem/v1/configs/{configIds}) for WAF attack logs, HTTP traffic logs, geographic logs, bot detection logs, and user-risk logs. - Queries Akamai's Reporting API v2 (
/reporting-api/v2/reports/delivery/traffic/current/data) for CDN traffic metrics across Edge Traffic, Origin Traffic, Midgress Traffic, and Offload Traffic metric categories. - EdgeGrid HMAC-SHA-256 request signing implemented in the Go backend.
- Handles Akamai's NDJSON SIEM response format, offset-token pagination, and the three-step URL/base64 rule-decoding process.
- Six security report views: Security Events(All), Attack Summary, IP Activity, Rule Analysis, User Activity, Path Analysis.
- Bundled overview dashboard exercising both query categories.
Compatibility
| Component | Version / Detail |
|---|---|
| Grafana | >= 12.3.0 |
| Akamai SIEM Integration API | v1 |
| Akamai Reporting API | v2 |
| Authentication | EdgeGrid HMAC-SHA-256 (Client Token + Client Secret + Access Token + Host) |
Visuals
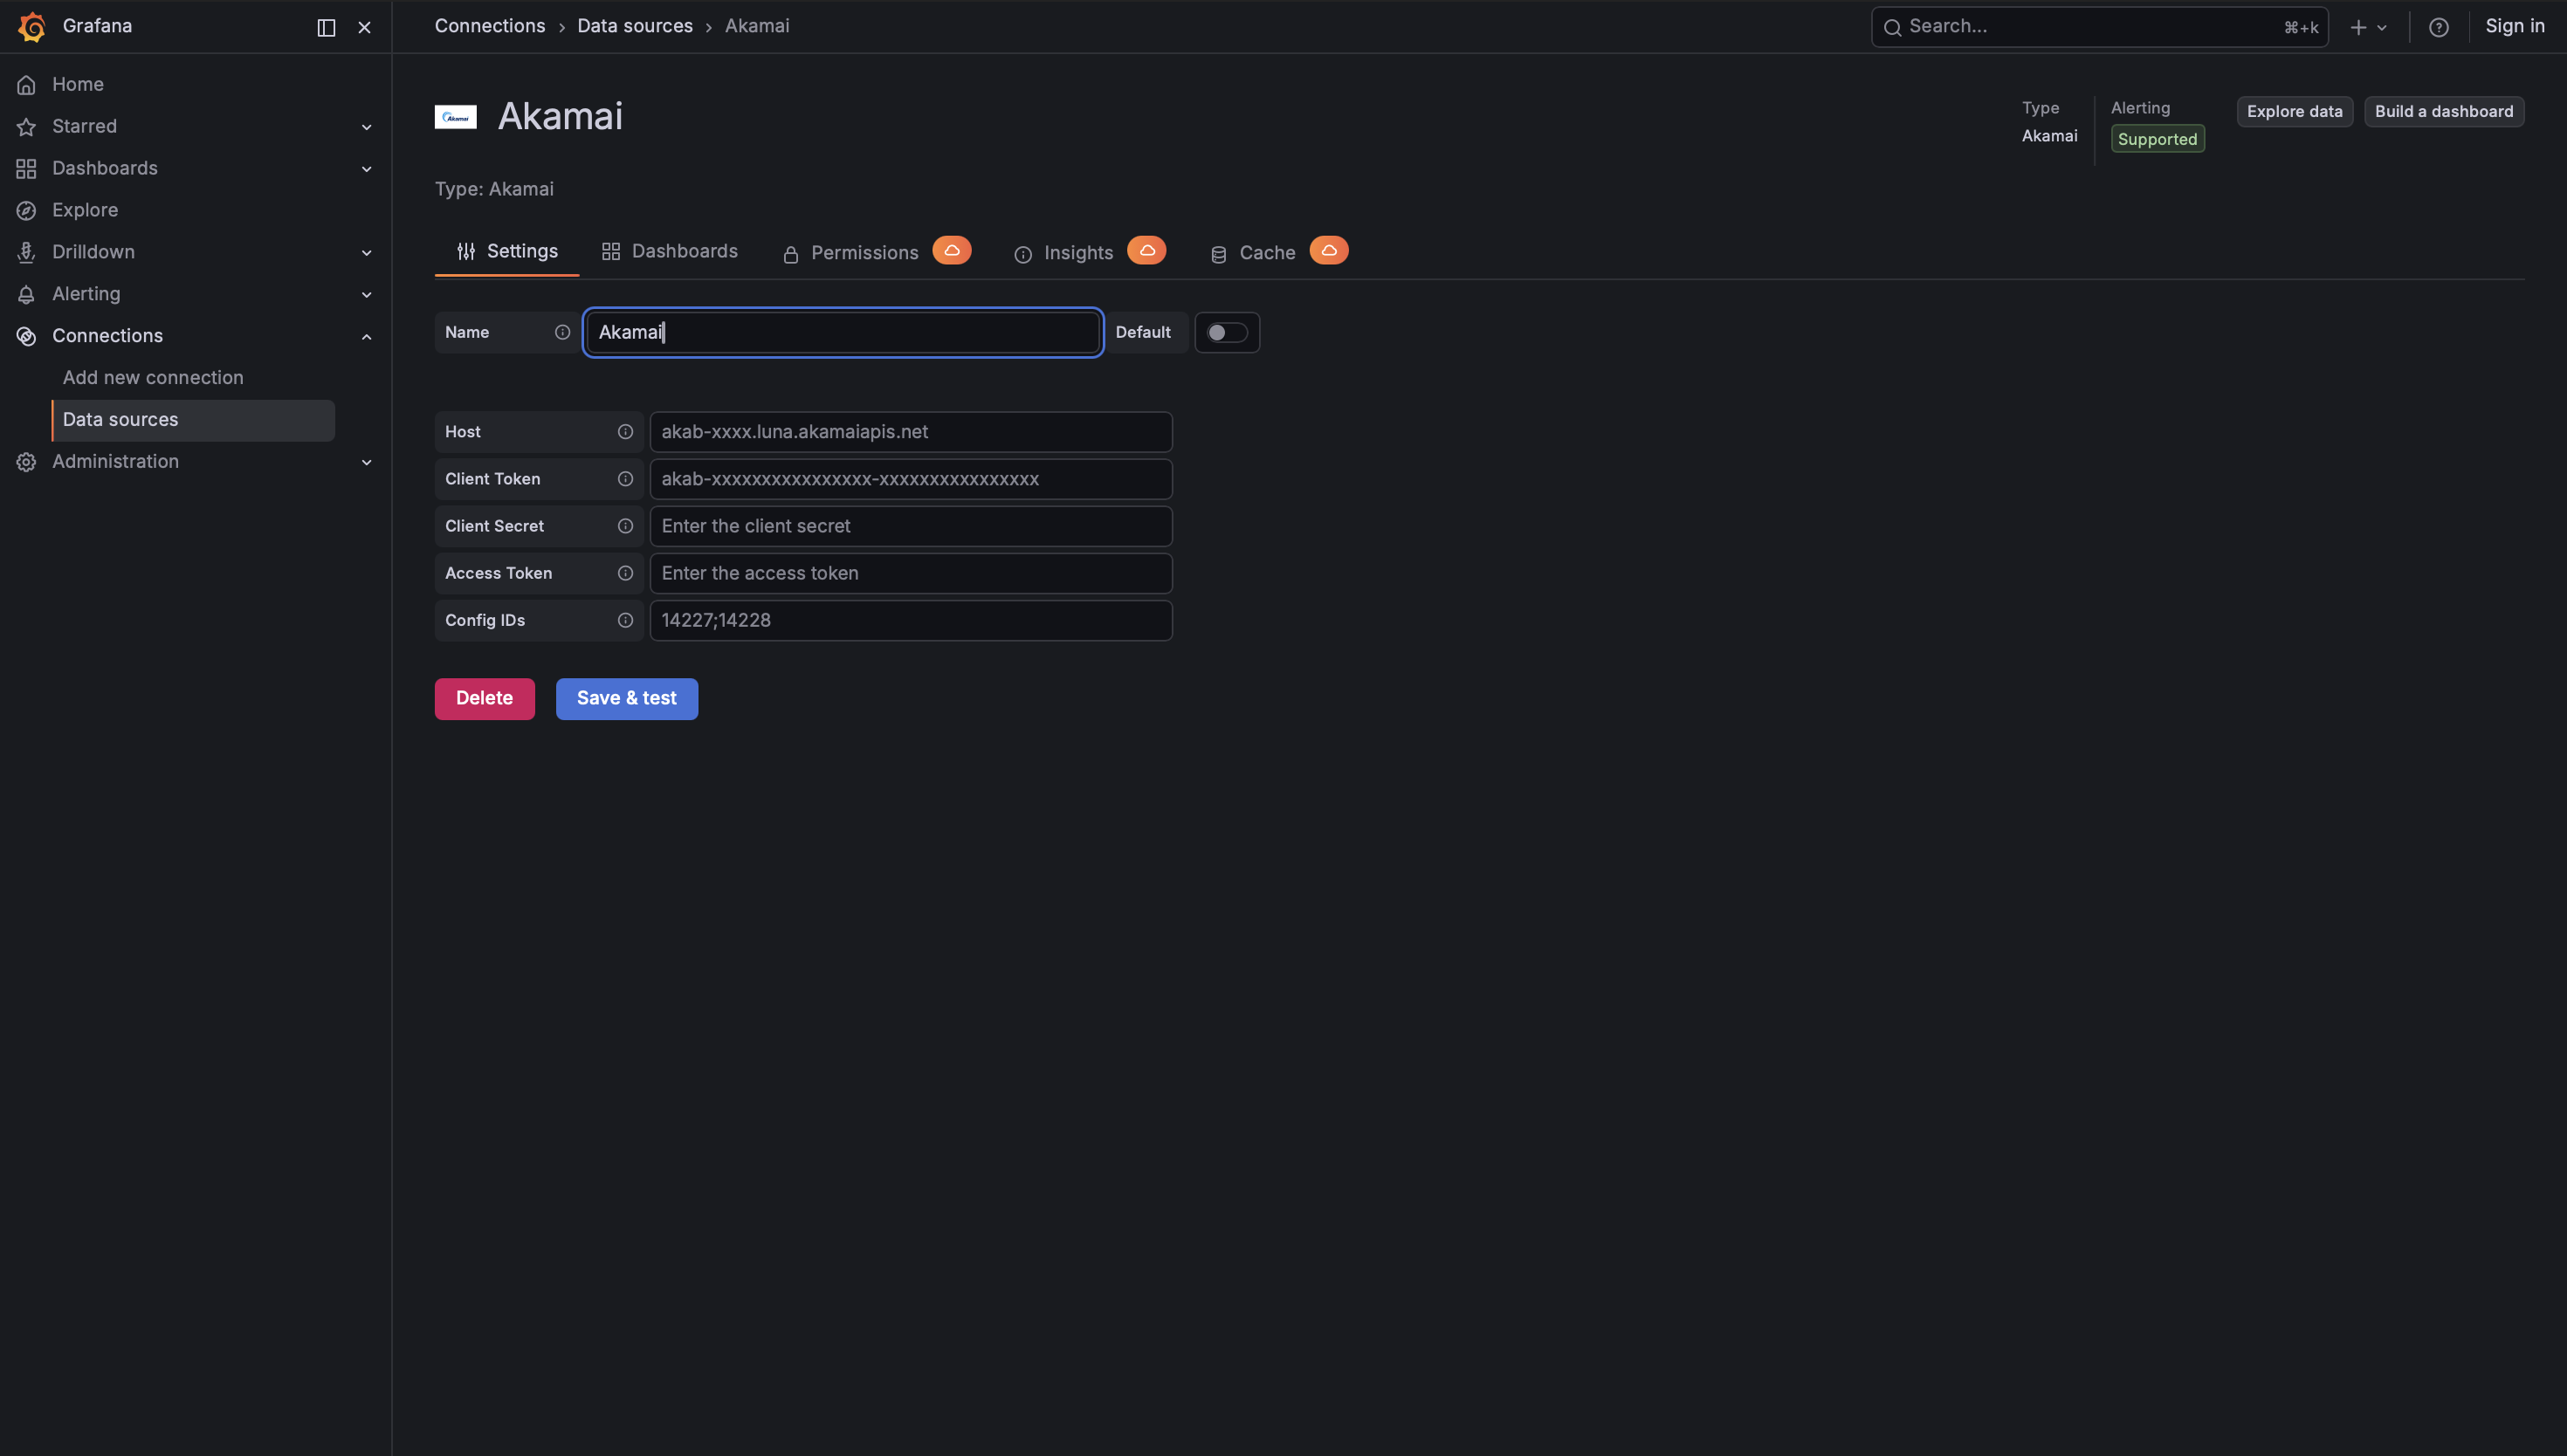
Configuration Editor
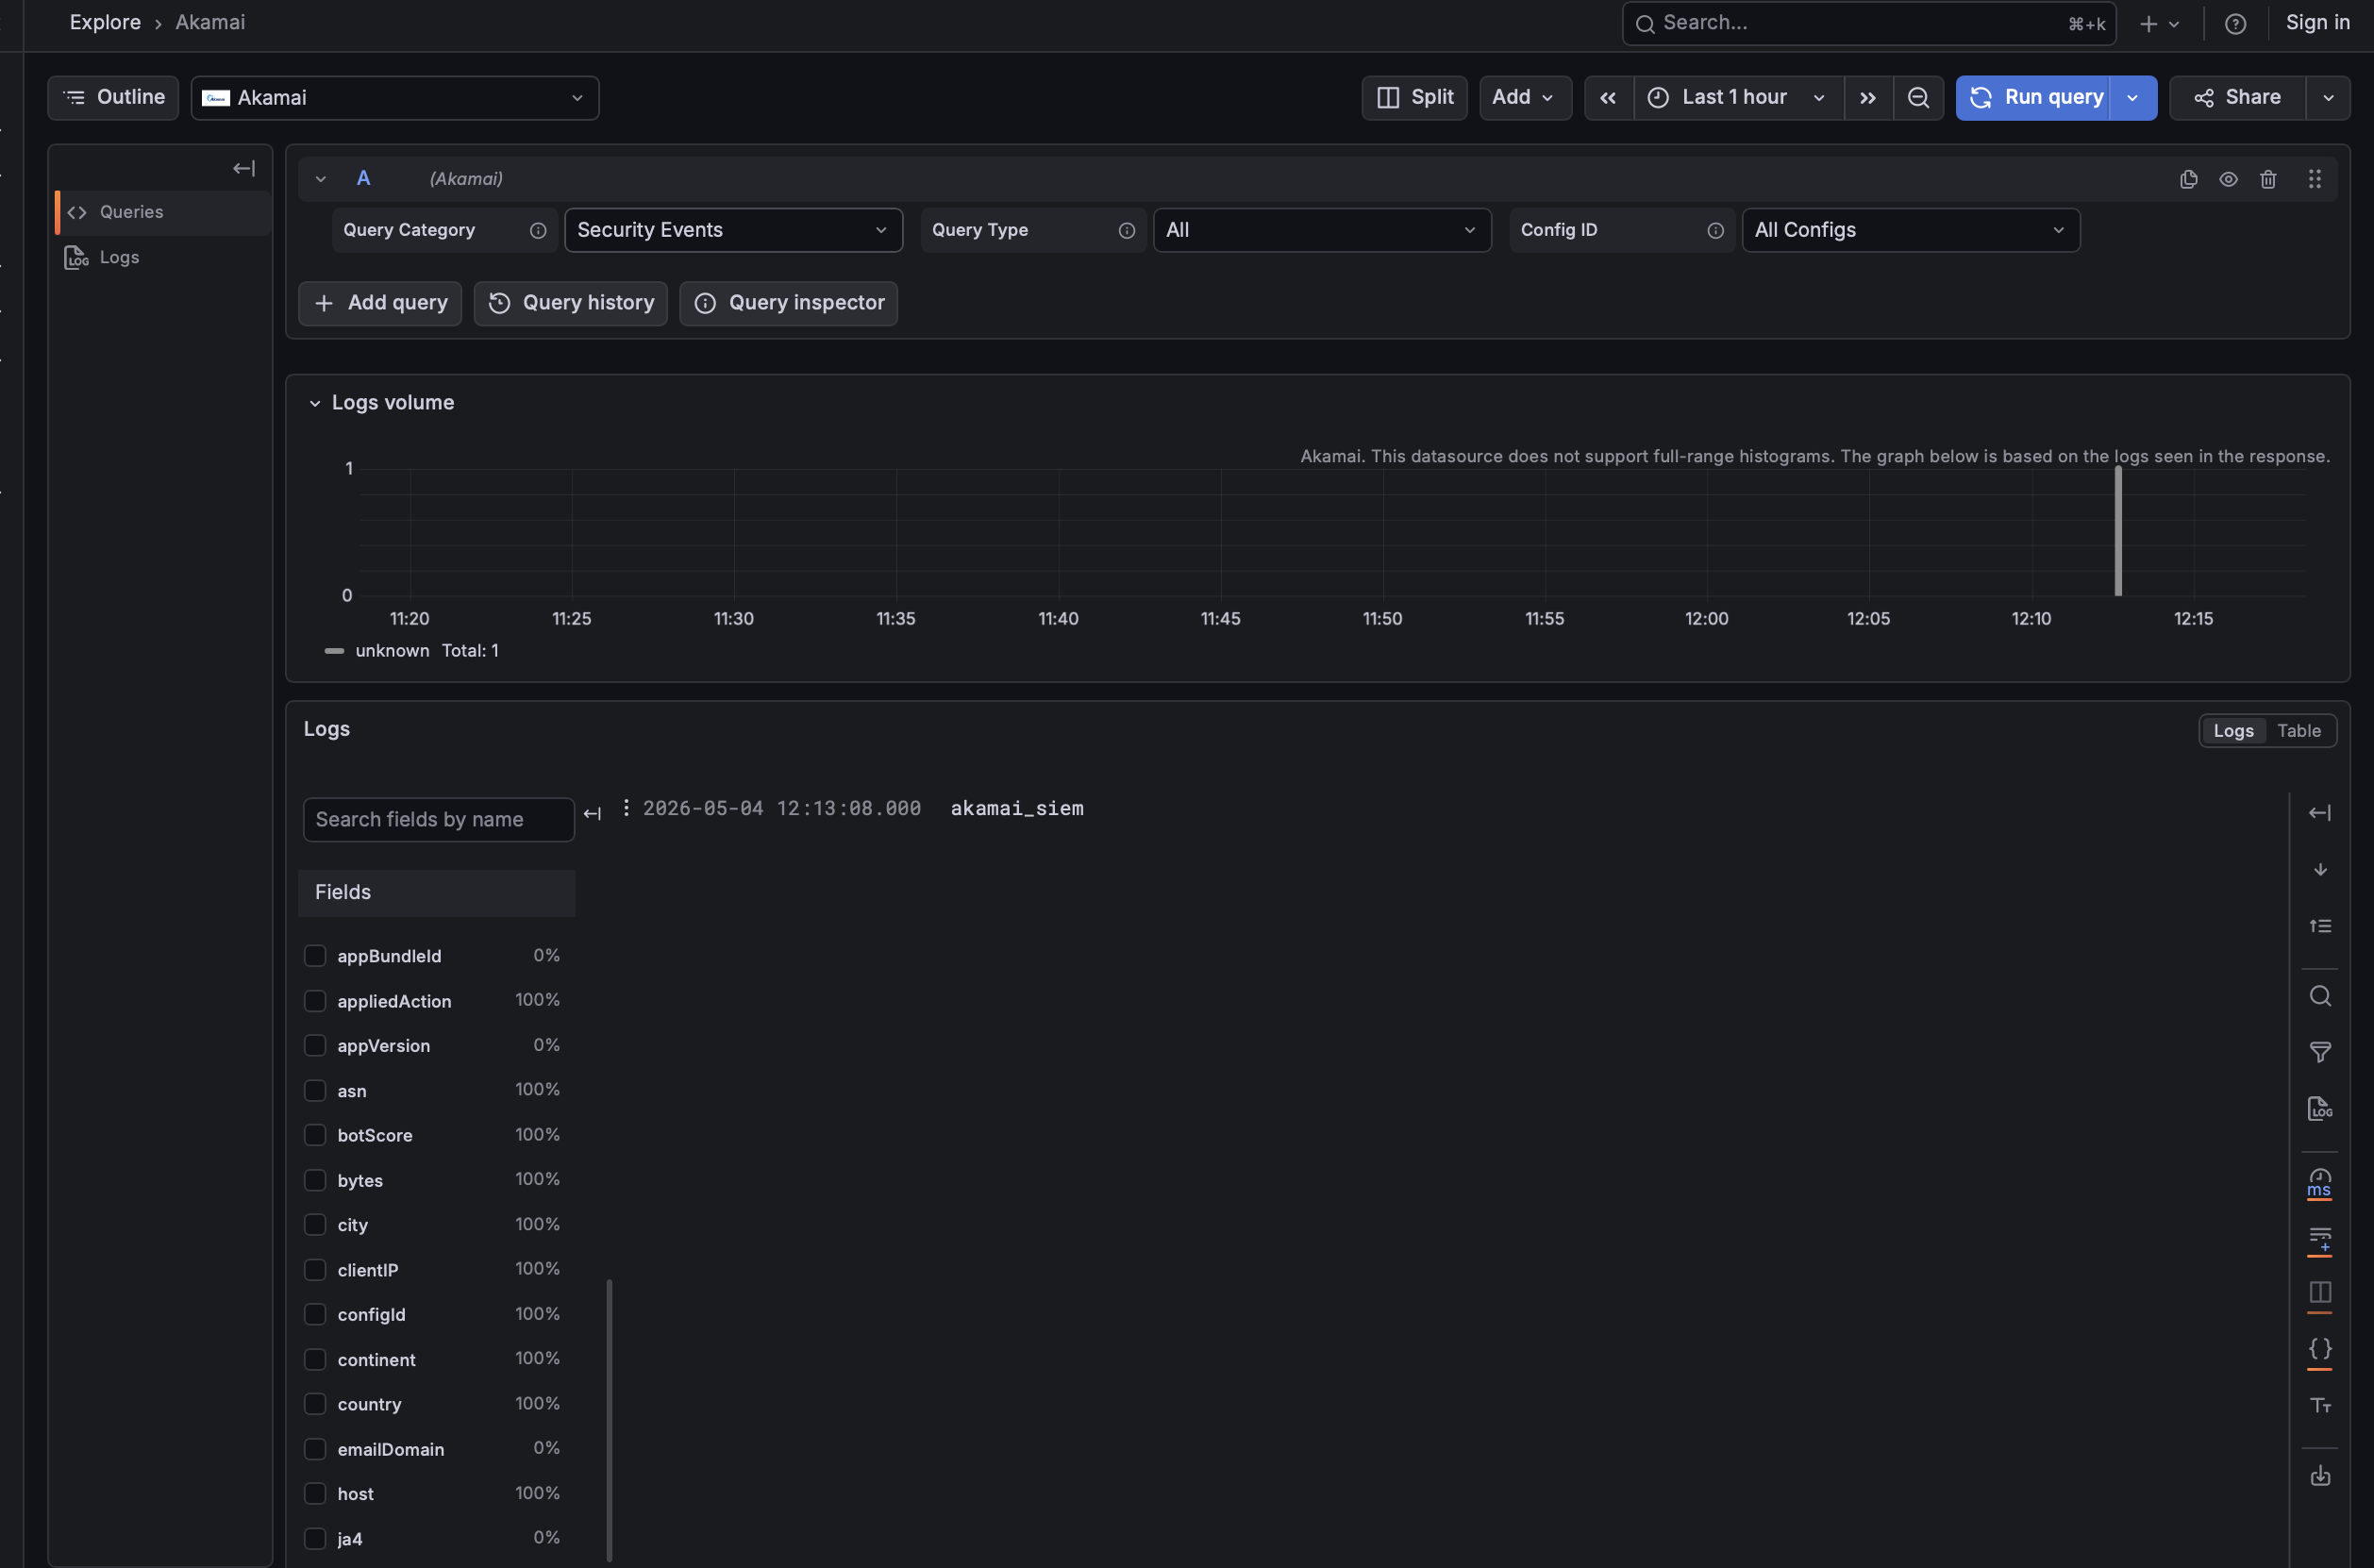
Query Editor
Installation
Prerequisites
- Grafana >= 12.3.0
- An active Akamai account with:
- SIEM Integration enabled on the security configurations you want to monitor
- An API client (with the Manage SIEM role) created in Identity & Access
- The four EdgeGrid credentials: Host, Client Token, Client Secret, Access Token
- The Web Security Configuration ID(s) you want to query
Obtain Akamai Credentials
- Sign in to the Akamai Control Center and open Security Configurations under Web & Data Center Security.
- Enable Data collection for SIEM Integration for each configuration you want to monitor and note the Web Security Configuration ID (for example
14227). - Under Account Admin → Identity & access → Users and API clients, create (or select) a user with the Manage SIEM role.
- Still under Users and API clients, click Create API client → Quick. Akamai will display the four credentials once: Client Secret, Client Token, Access Token, Host. Save them somewhere secure — the Client Secret cannot be retrieved later.
Install the Plugin
Install from the Grafana plugin catalog or via the Grafana CLI:
grafana cli plugins install crestdata-akamai-datasource
Restart the Grafana server so the plugin is loaded.
Configure the Data Source
In Grafana, go to Connections → Data Sources → Add data source, search for Akamai, and fill in:
| Field | Required | Description |
|---|---|---|
| Host | Yes | Akamai API hostname (e.g. akab-xxxx.luna.akamaiapis.net). No scheme. |
| Client Token | Yes | EdgeGrid client token (starts with akab-). Identifier; not a secret. |
| Client Secret | Yes | EdgeGrid client secret. Base64 HMAC signing key. Stored encrypted. |
| Access Token | Yes | EdgeGrid access token (starts with akab-). Stored encrypted. |
| Config IDs | Yes* | Web Security Configuration IDs for SIEM queries. Semicolon-separated for multiple (e.g. 14227;14228). |
* Required if you plan to run any Security Reports query.
Query Types
The query editor exposes two Query Categories: Security Events and CDN Traffic Metrics.
Security Events (SIEM API)
All Security Reports queries call GET /siem/v1/configs/{configIds}?from=...&to=..., page through the offset-token response, and produce one of six views:
| Query Type | Frame Type | Primary Columns |
|---|---|---|
| All | Logs | time, body, clientIP, country, policyId, appliedAction, rules (decoded) |
| Attack Summary | Table | appliedAction, policyId, count |
| IP Activity | Table | clientIP, country, city, count, bytes |
| Rule Analysis | Table | rules, ruleTags, ruleMessages, count |
| User Activity | Table | username, emailDomain, risk, count, maxScore |
| Path Analysis | Table | path, host, status, count, bytesSum |
CDN Traffic Metrics (Reporting API v2)
All CDN Traffic Metrics queries call GET /reporting-api/v2/reports/delivery/traffic/current/data with start/end time range and return a table frame. The Metric Category selects which traffic metric set to request:
| Metric Category | Metrics |
|---|---|
| Edge Traffic | edgeBytesSum, edgeHitsSum, edgeResponseBytesSum, edgeRequestBytesSum |
| Origin Traffic | originBytesSum, originHitsSum, originResponseBytesSum, originRequestBytesSum |
| Midgress Traffic | midgressHitsSum, midgressBytesSum, midgressResponseBytesSum, midgressRequestBytesSum |
| Offload Traffic | offloadedHitsPercentage, offloadedBytesPercentage, offloadedRequestBytesPercentage, offloadedResponseBytesPercentage |
Dimensions: hostname, responseCode.
Time Range Handling
- SIEM enforces a 12-hour data-retention window. If Grafana's
fromis older thanto - 12h, the plugin clampsfromtoto - 12hand logs a warning. Very long historical queries are therefore not supported. - Reporting API has no comparable limit; its data retention is governed by your Akamai contract.
- The SIEM loop pauses 1 second between pages to respect Akamai's ≤ 1 req/sec guideline.
Error Handling
| HTTP Status | Retry | Message |
|---|---|---|
| 401 | No | Authentication failed — verify Client Token, Client Secret, Access Token |
| 403 | No | Access denied — confirm SIEM Integration is enabled |
| 404 | No | Endpoint not found — verify Host |
| 408 | Yes (exp. backoff) | Request timeout |
| 429 | Yes (exp. backoff) | Rate limited — Akamai recommends ≤ 1 req/sec |
| 500/502/503/504 | Yes (exp. backoff) | Transient Akamai API error |
Max retries: 3, base delay 2 seconds (2s, 4s, 8s).
Troubleshooting
- "Authentication failed": the four credentials must match exactly. Remember that the Client Secret is shown only once on the Akamai side — regenerate if lost.
- "Access denied": enable SIEM Integration for the security configuration in the Akamai Control Center and make sure the API client user has the Manage SIEM role.
- "Endpoint not found": remove any
https://prefix or trailing slash from Host. The backend strips these but other parsing tools may not. - "Request timed out": Akamai edge latency is usually < 5 s; a timeout indicates a network issue. The default client timeout is 30 s, health check 45 s.
Development
# backend
go test ./pkg/...
mage -v build:linux

# frontend
npm install
npm run dev         # live-rebuild
npm run test:ci     # unit tests
npm run e2e         # Playwright e2e
npm run server      # `docker compose up` - runs Grafana with the plugin mounted
References
- Akamai SIEM Integration API
- EdgeGrid Authentication
- Akamai Reporting API v2 — delivery/traffic/current
- Grafana Plugin Development
License
This plugin is distributed under a custom End User License (EULA). See the LICENSE file for details.
Plugin Insights
Quality scores for version 1.0.2
- Status: PassedSecurity
Minor improvements possible
- Status: PassedMaintenance
All checks passed
- Status: PassedDocumentation
All checks passed
- Version
- 1.0.2
- Dependencies
- Grafana >=12.3.0
- Developer
- crestdata
- Last Updated
- May 7, 2026