Plugins 〉Ask O11y


Ask O11y
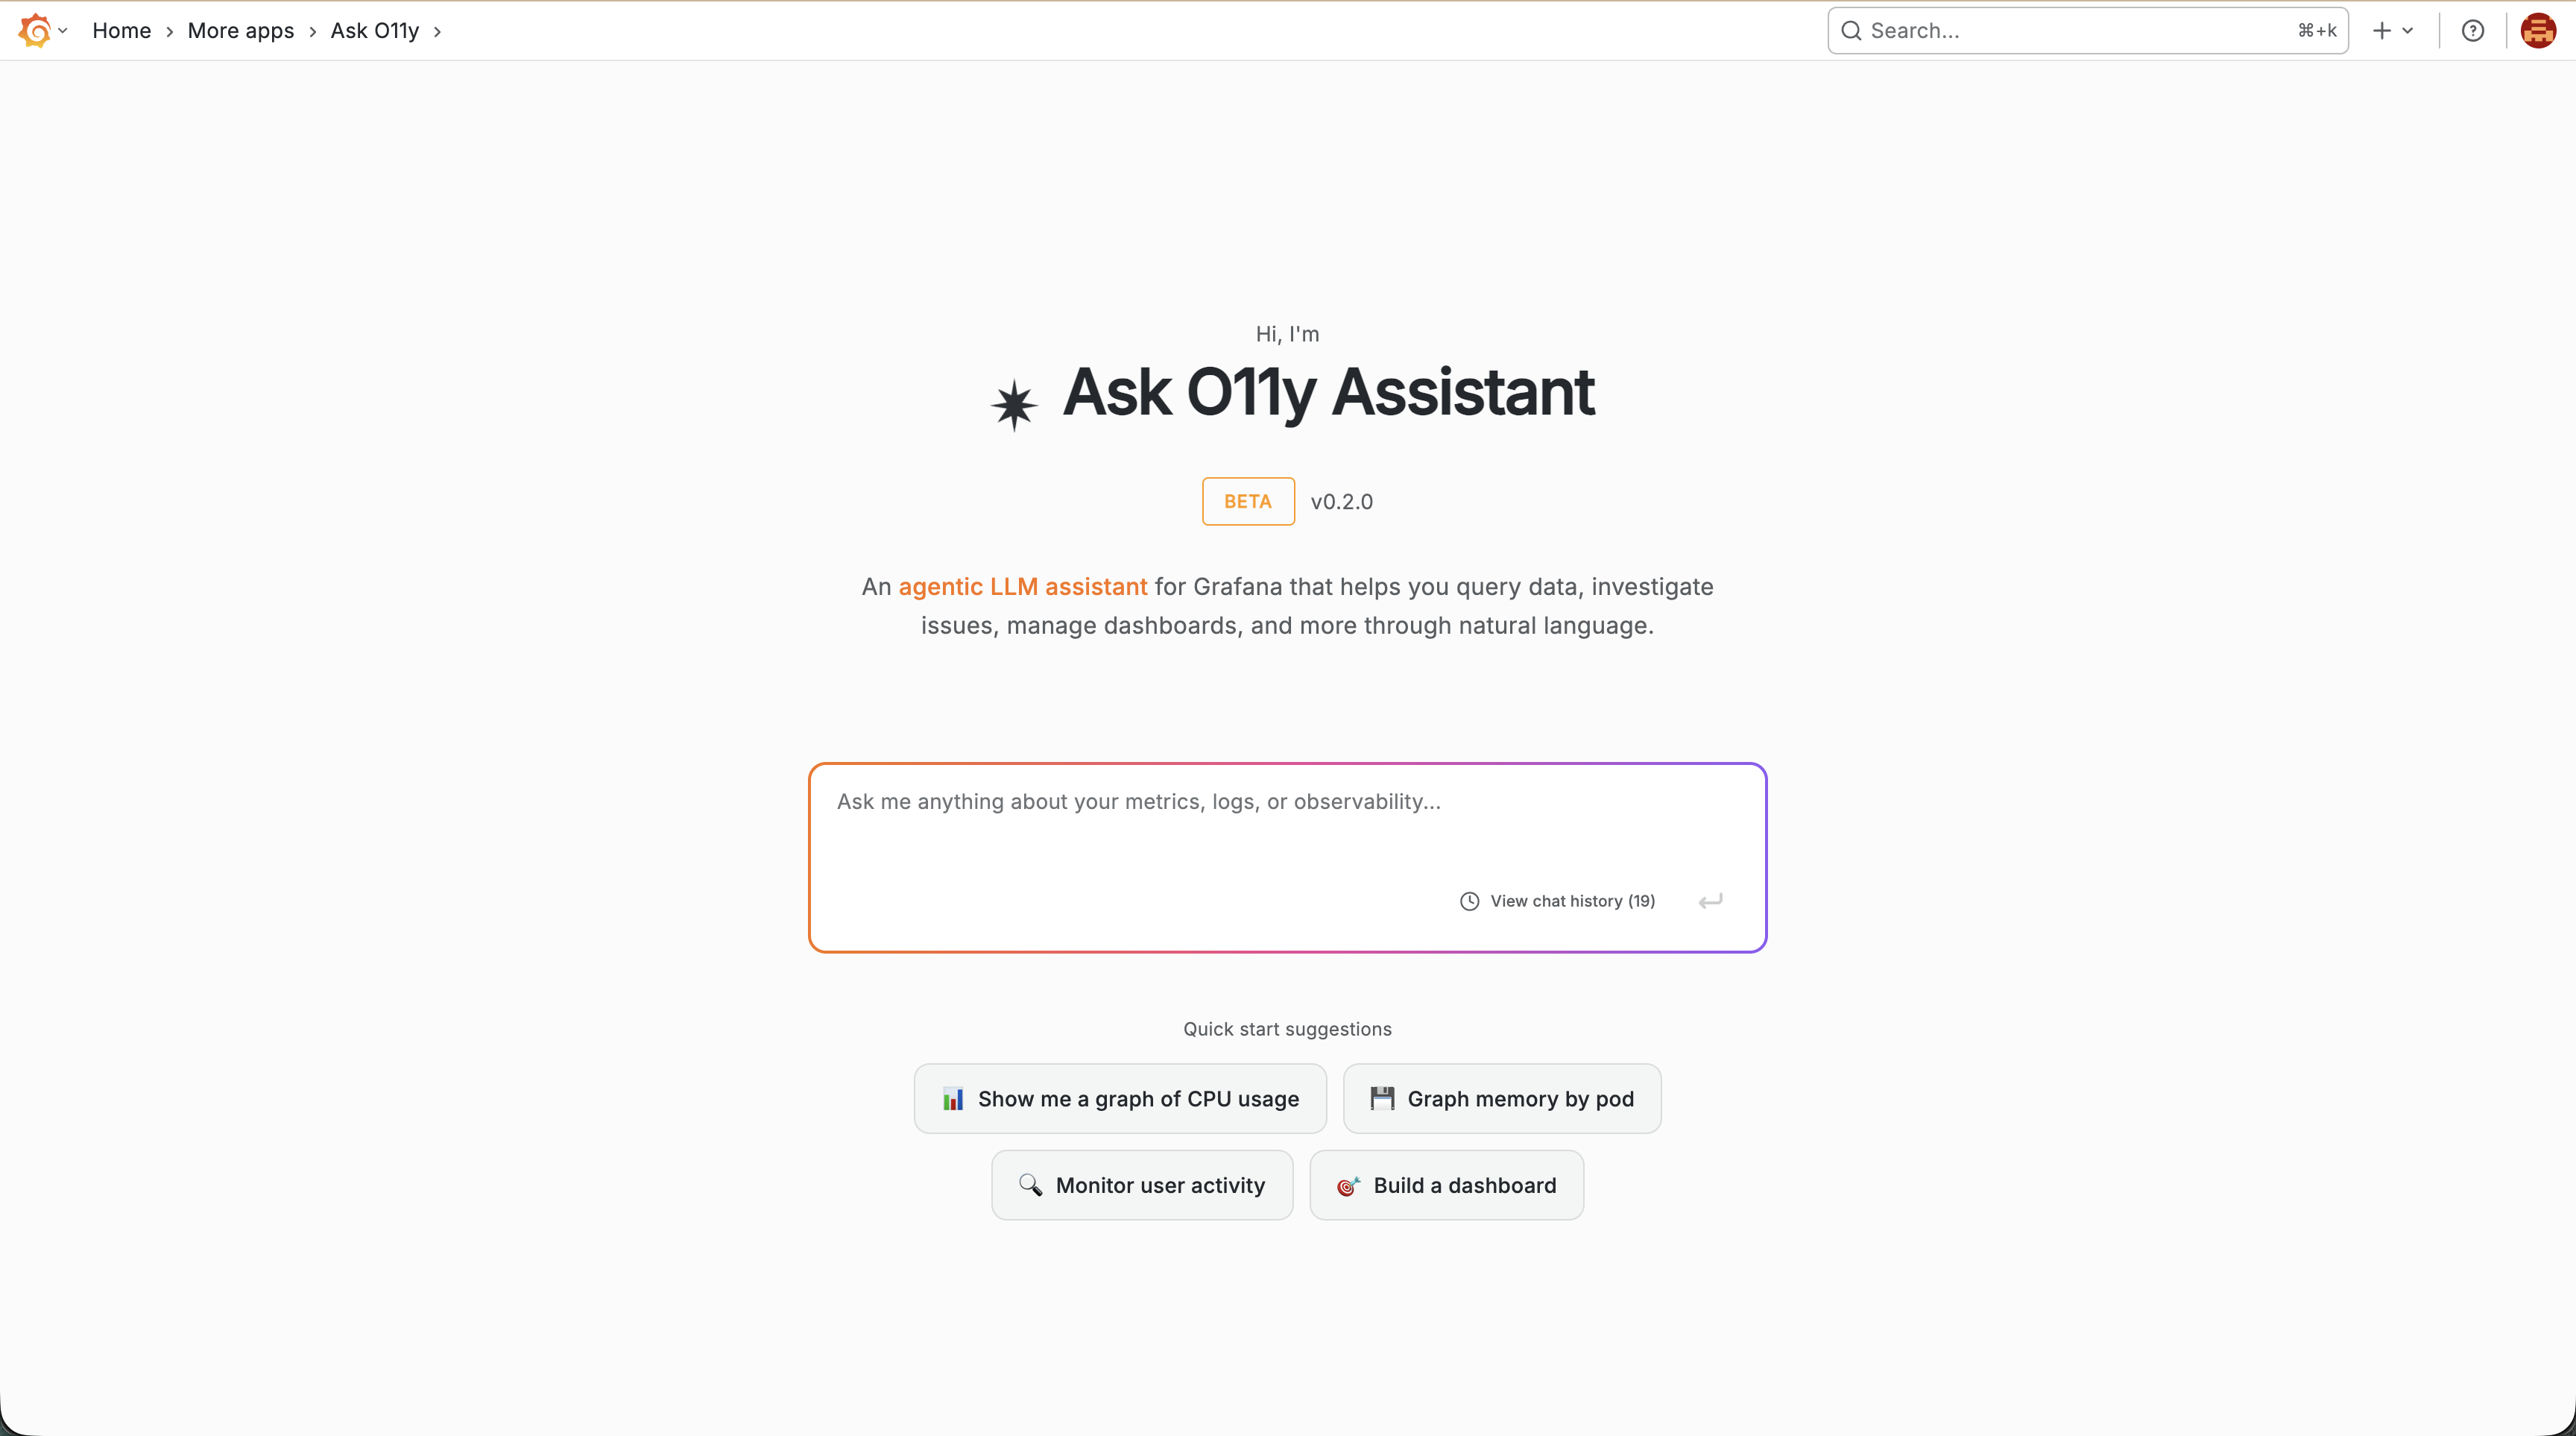
Ask O11y - AI-Powered Observability Assistant
![]()

Overview
Ask O11y is an AI-powered Grafana app that lets you query metrics, analyze logs, create dashboards, and troubleshoot issues through natural language conversations—no need to write PromQL, LogQL, or TraceQL.
Simply ask questions like:
- "Show me CPU usage across all servers in the last hour"
- "Find error logs from the payment service"
- "Create a dashboard to monitor Kubernetes cluster health"
- "What's causing the spike in response times?"
Prerequisites
Before installing Ask O11y, you must have:
1. Grafana LLM Plugin (Required)
Ask O11y requires the Grafana LLM plugin to be installed and configured with an AI provider.
Setup:
- Install the Grafana LLM plugin from the Grafana catalog
- Enable it in Configuration → Plugins → Grafana LLM
- Configure your AI provider (OpenAI, Anthropic, etc.) with a valid API key
2. Enable Service Account Feature (Self-Hosted Grafana)
If you're running Grafana on-premises or in Docker, you need to enable external service accounts:
# In your docker-compose.yaml or Grafana configuration
environment:
  - GF_FEATURE_TOGGLES_ENABLE=externalServiceAccounts
  - GF_AUTH_MANAGED_SERVICE_ACCOUNTS_ENABLED=true
Note for Grafana Cloud users: Service accounts are enabled by default. Skip this step.
3. Grafana MCP Server (Required)
Important: Ask O11y requires a configured Grafana MCP server that provides the tools that allow Ask O11y to interact with your Grafana instance (query datasources, create dashboards, manage alerts, etc.).
Setup Steps:
There are two ways to set this up:
Option A: Use the Built-in Grafana MCP toggle (RECOMMENDED)
- Go to Configuration → Plugins → Ask O11y → Configuration
- Enable the Use Built-in Grafana MCP toggle
- Click Save
This automatically uses the MCP server provided by grafana-llm-app.
Option B: Configure an external MCP server (only required for multi-org grafana deployments )
Use this option if you are on a multi-org Grafana instance:
- deploy Grafana MCP and configure it to point at your grafana instance, without setting GRAFANA_ORG_ID
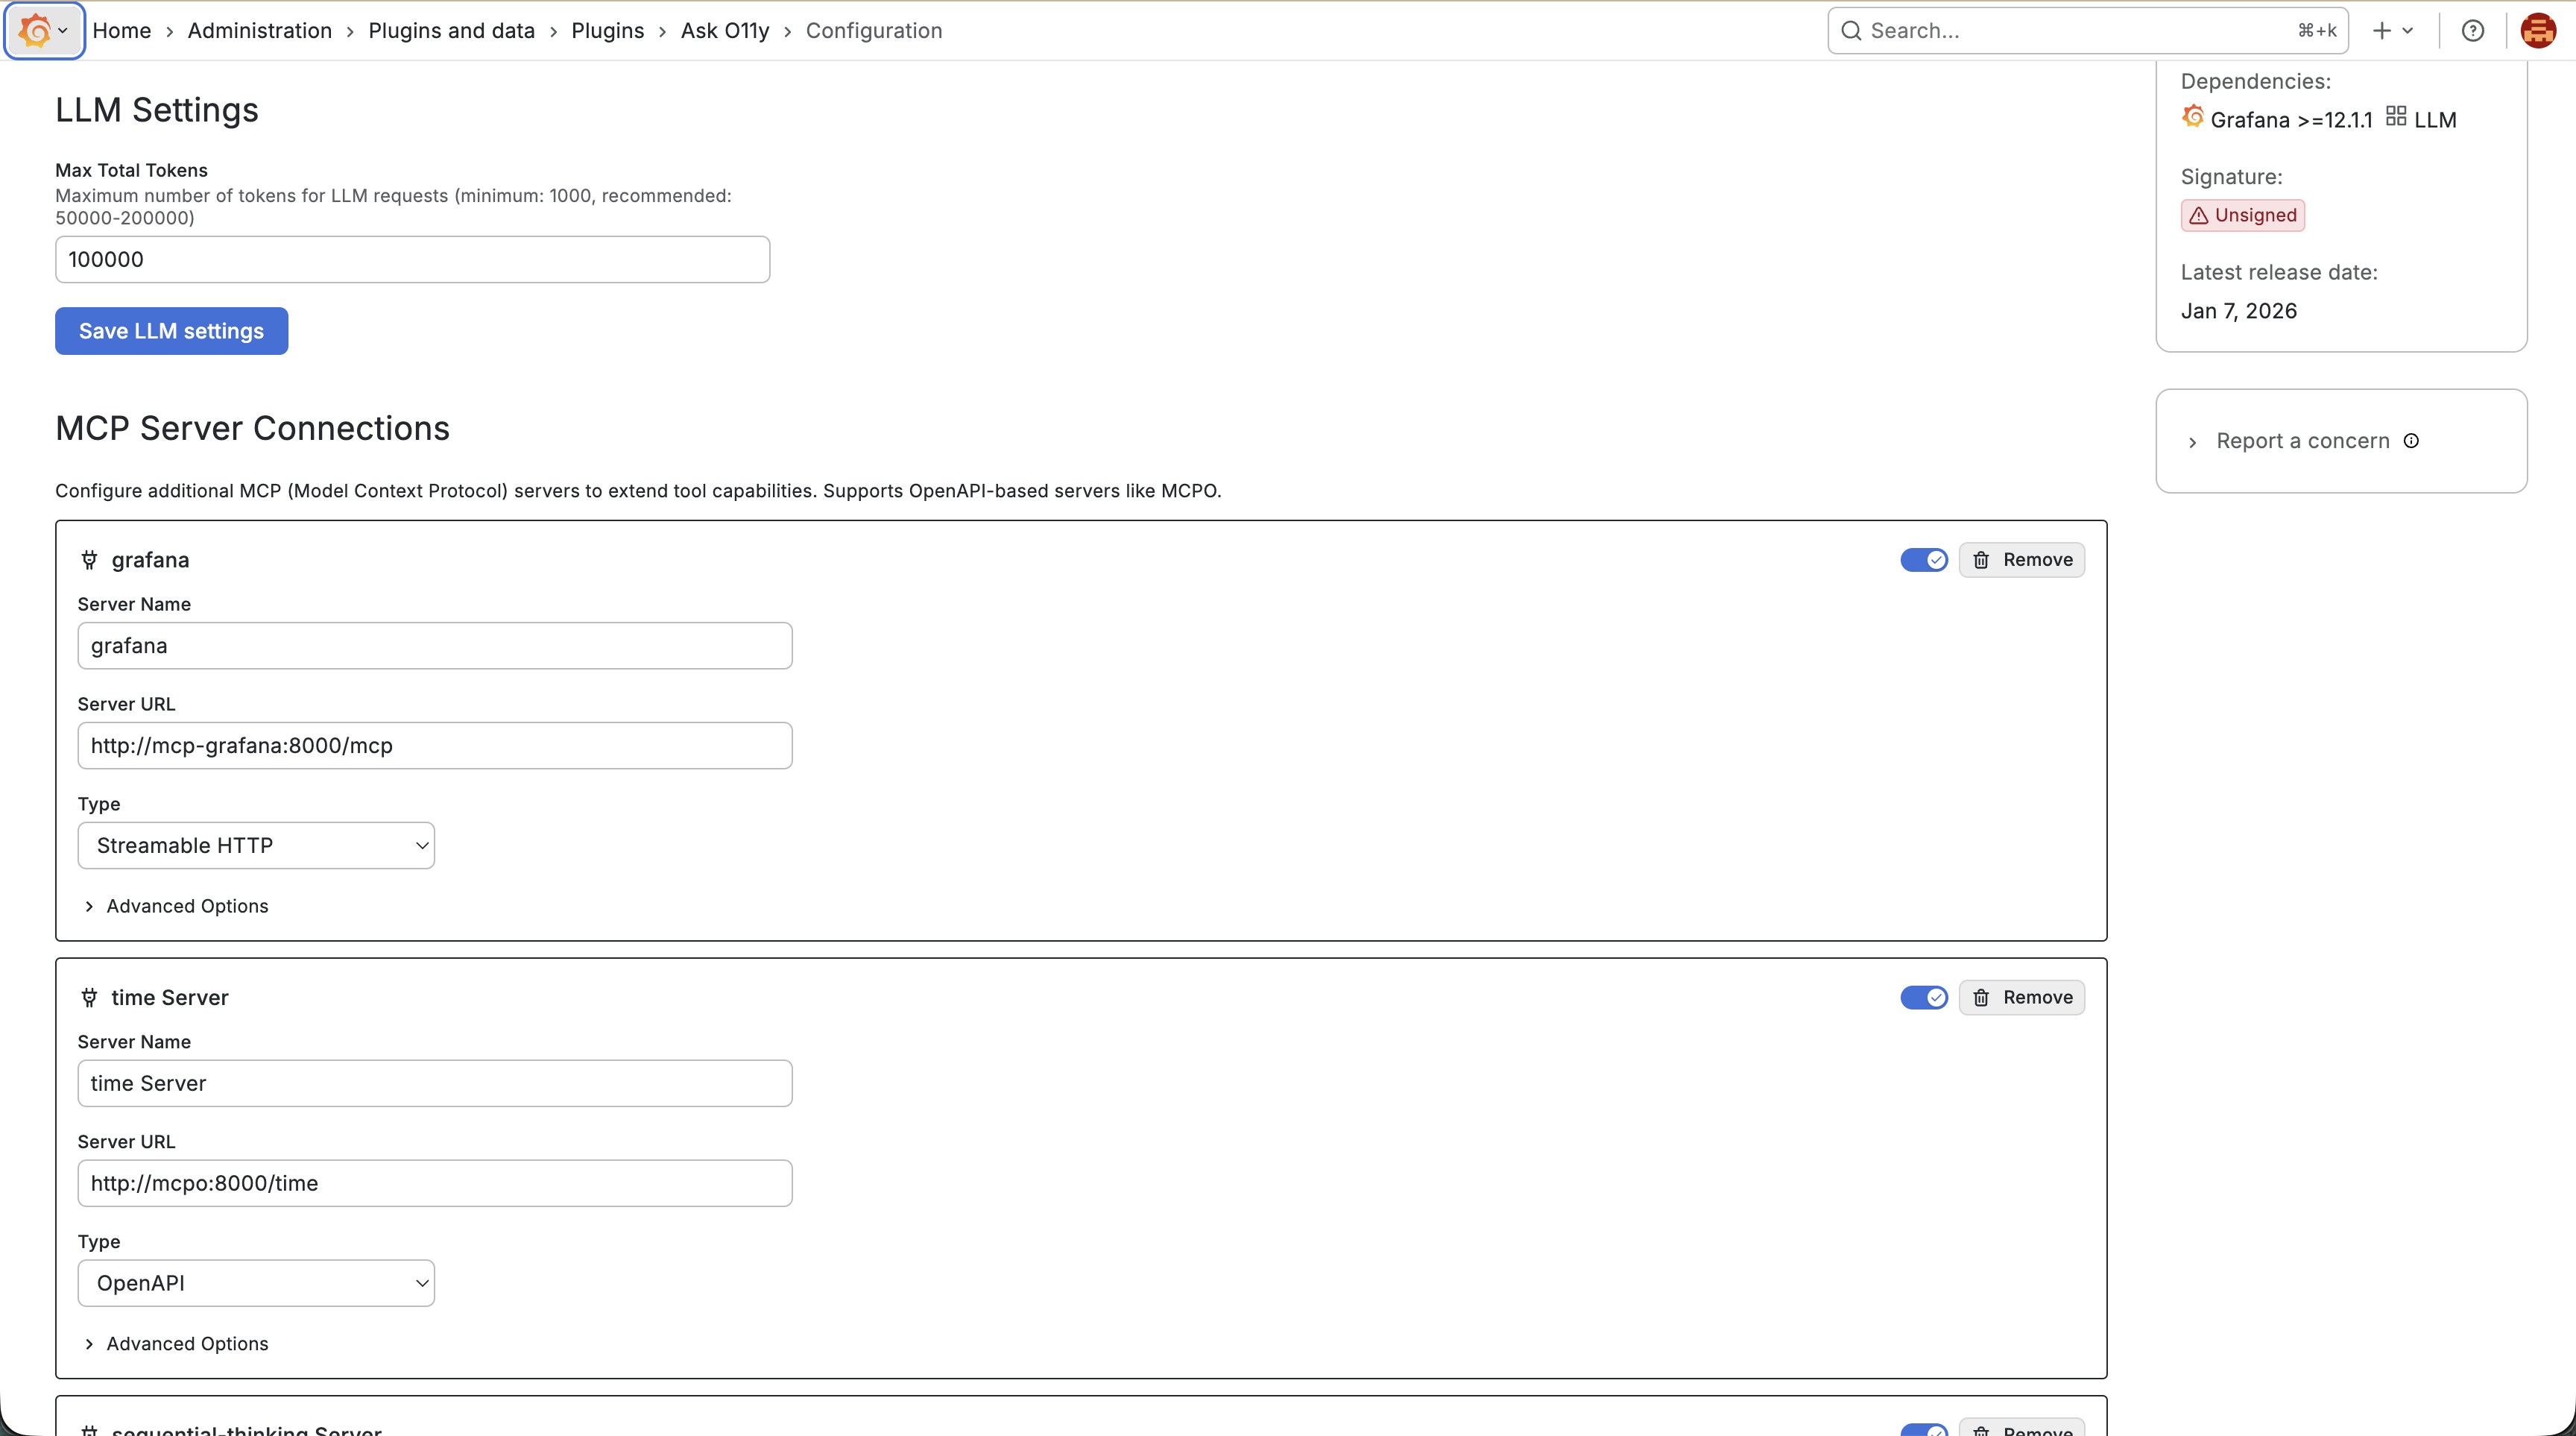
- Go to Configuration → Plugins → Ask O11y → Configuration
- Under MCP Servers, add a new server:
- Name:
grafana(or any descriptive name) - URL: Your Grafana MCP endpoint
- Self-hosted / Docker:
http://mcp-grafana-host:mcp-grafana-port/mcp
- Self-hosted / Docker:
- Type:
streamable-http - Enabled: ✓ (checked)
- Name:
- Click Save
- Verify the server shows as Healthy in the status indicators
Installation
- In Grafana, go to Administration → Plugins and data → Plugins
- Search for "Ask O11y"
- Click Install
- Navigate to Apps → Ask O11y
For manual installation, download from GitHub Releases and extract to your Grafana plugins directory.
Quick Start
- Navigate to Apps → Ask O11y
- Click New Chat
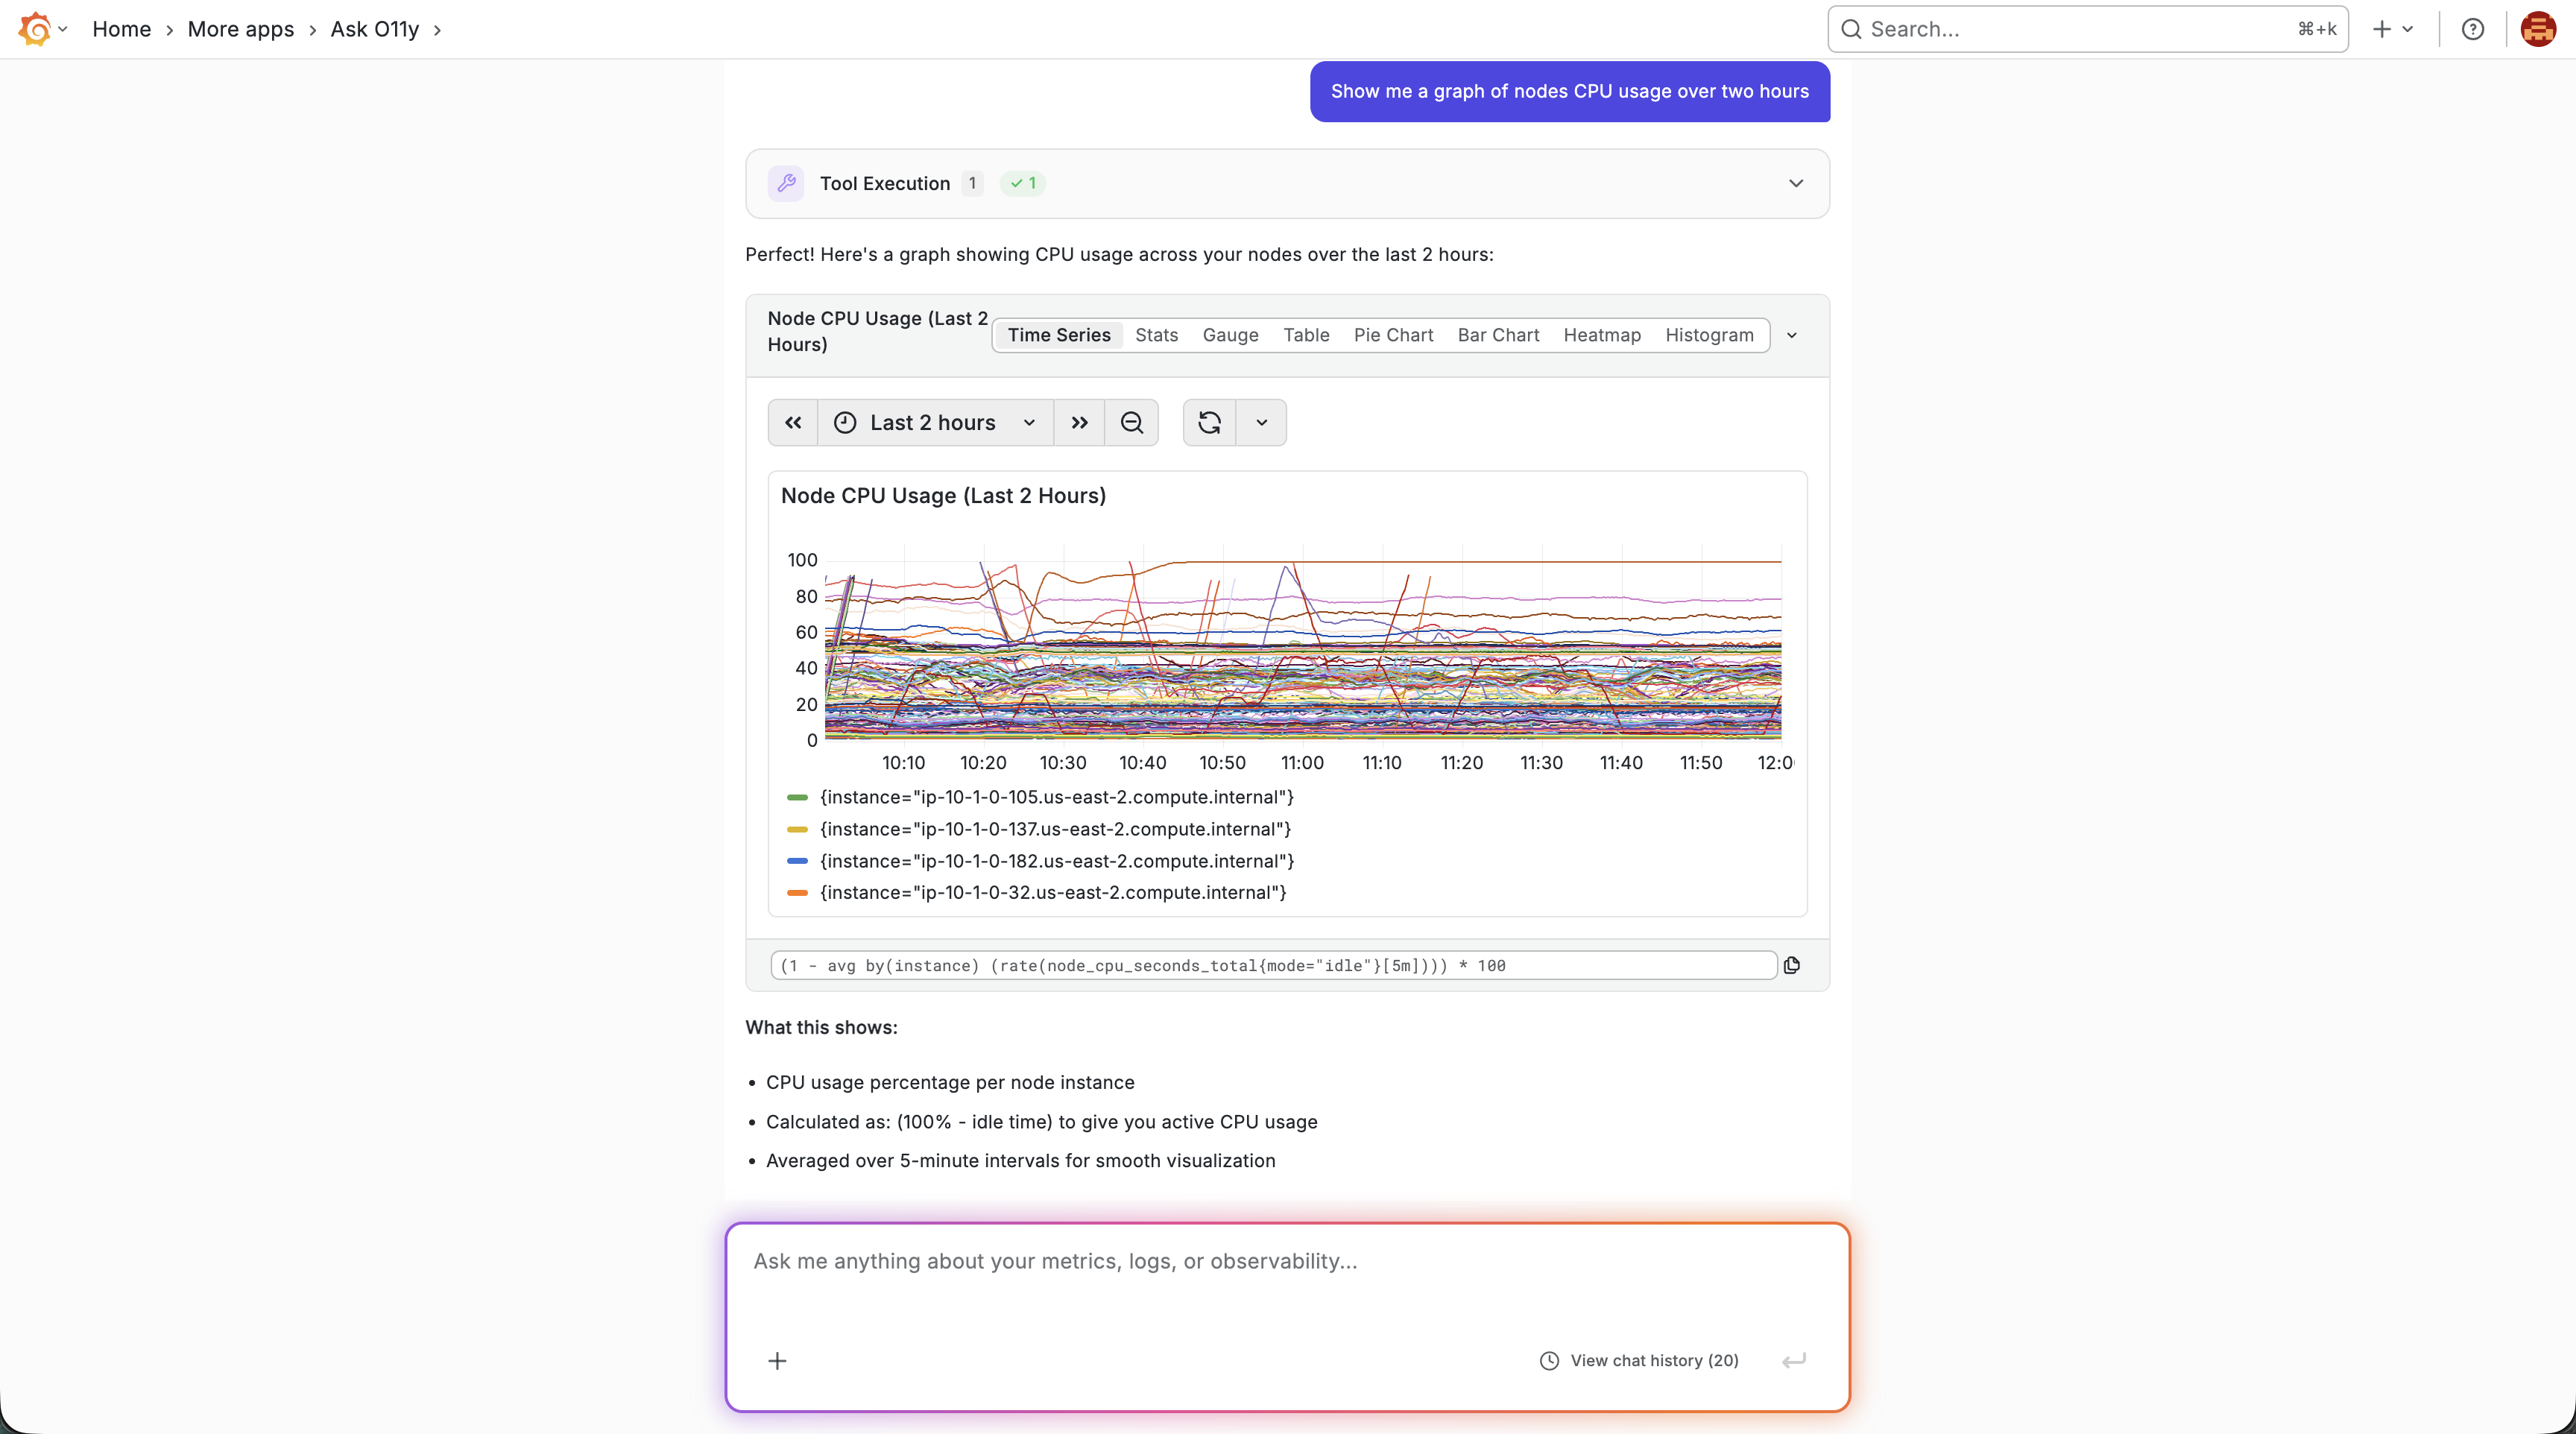
- Ask a question: "Show me CPU usage in the last hour"
Features
Natural Language Queries
- Metrics: "Show me HTTP request rate grouped by endpoint"
- Logs: "Find all timeout errors in the last 15 minutes"
- Traces: "Show traces for the checkout API with duration > 500ms"
- Dashboards: "Create a dashboard to monitor Kubernetes cluster health"
Visualizations
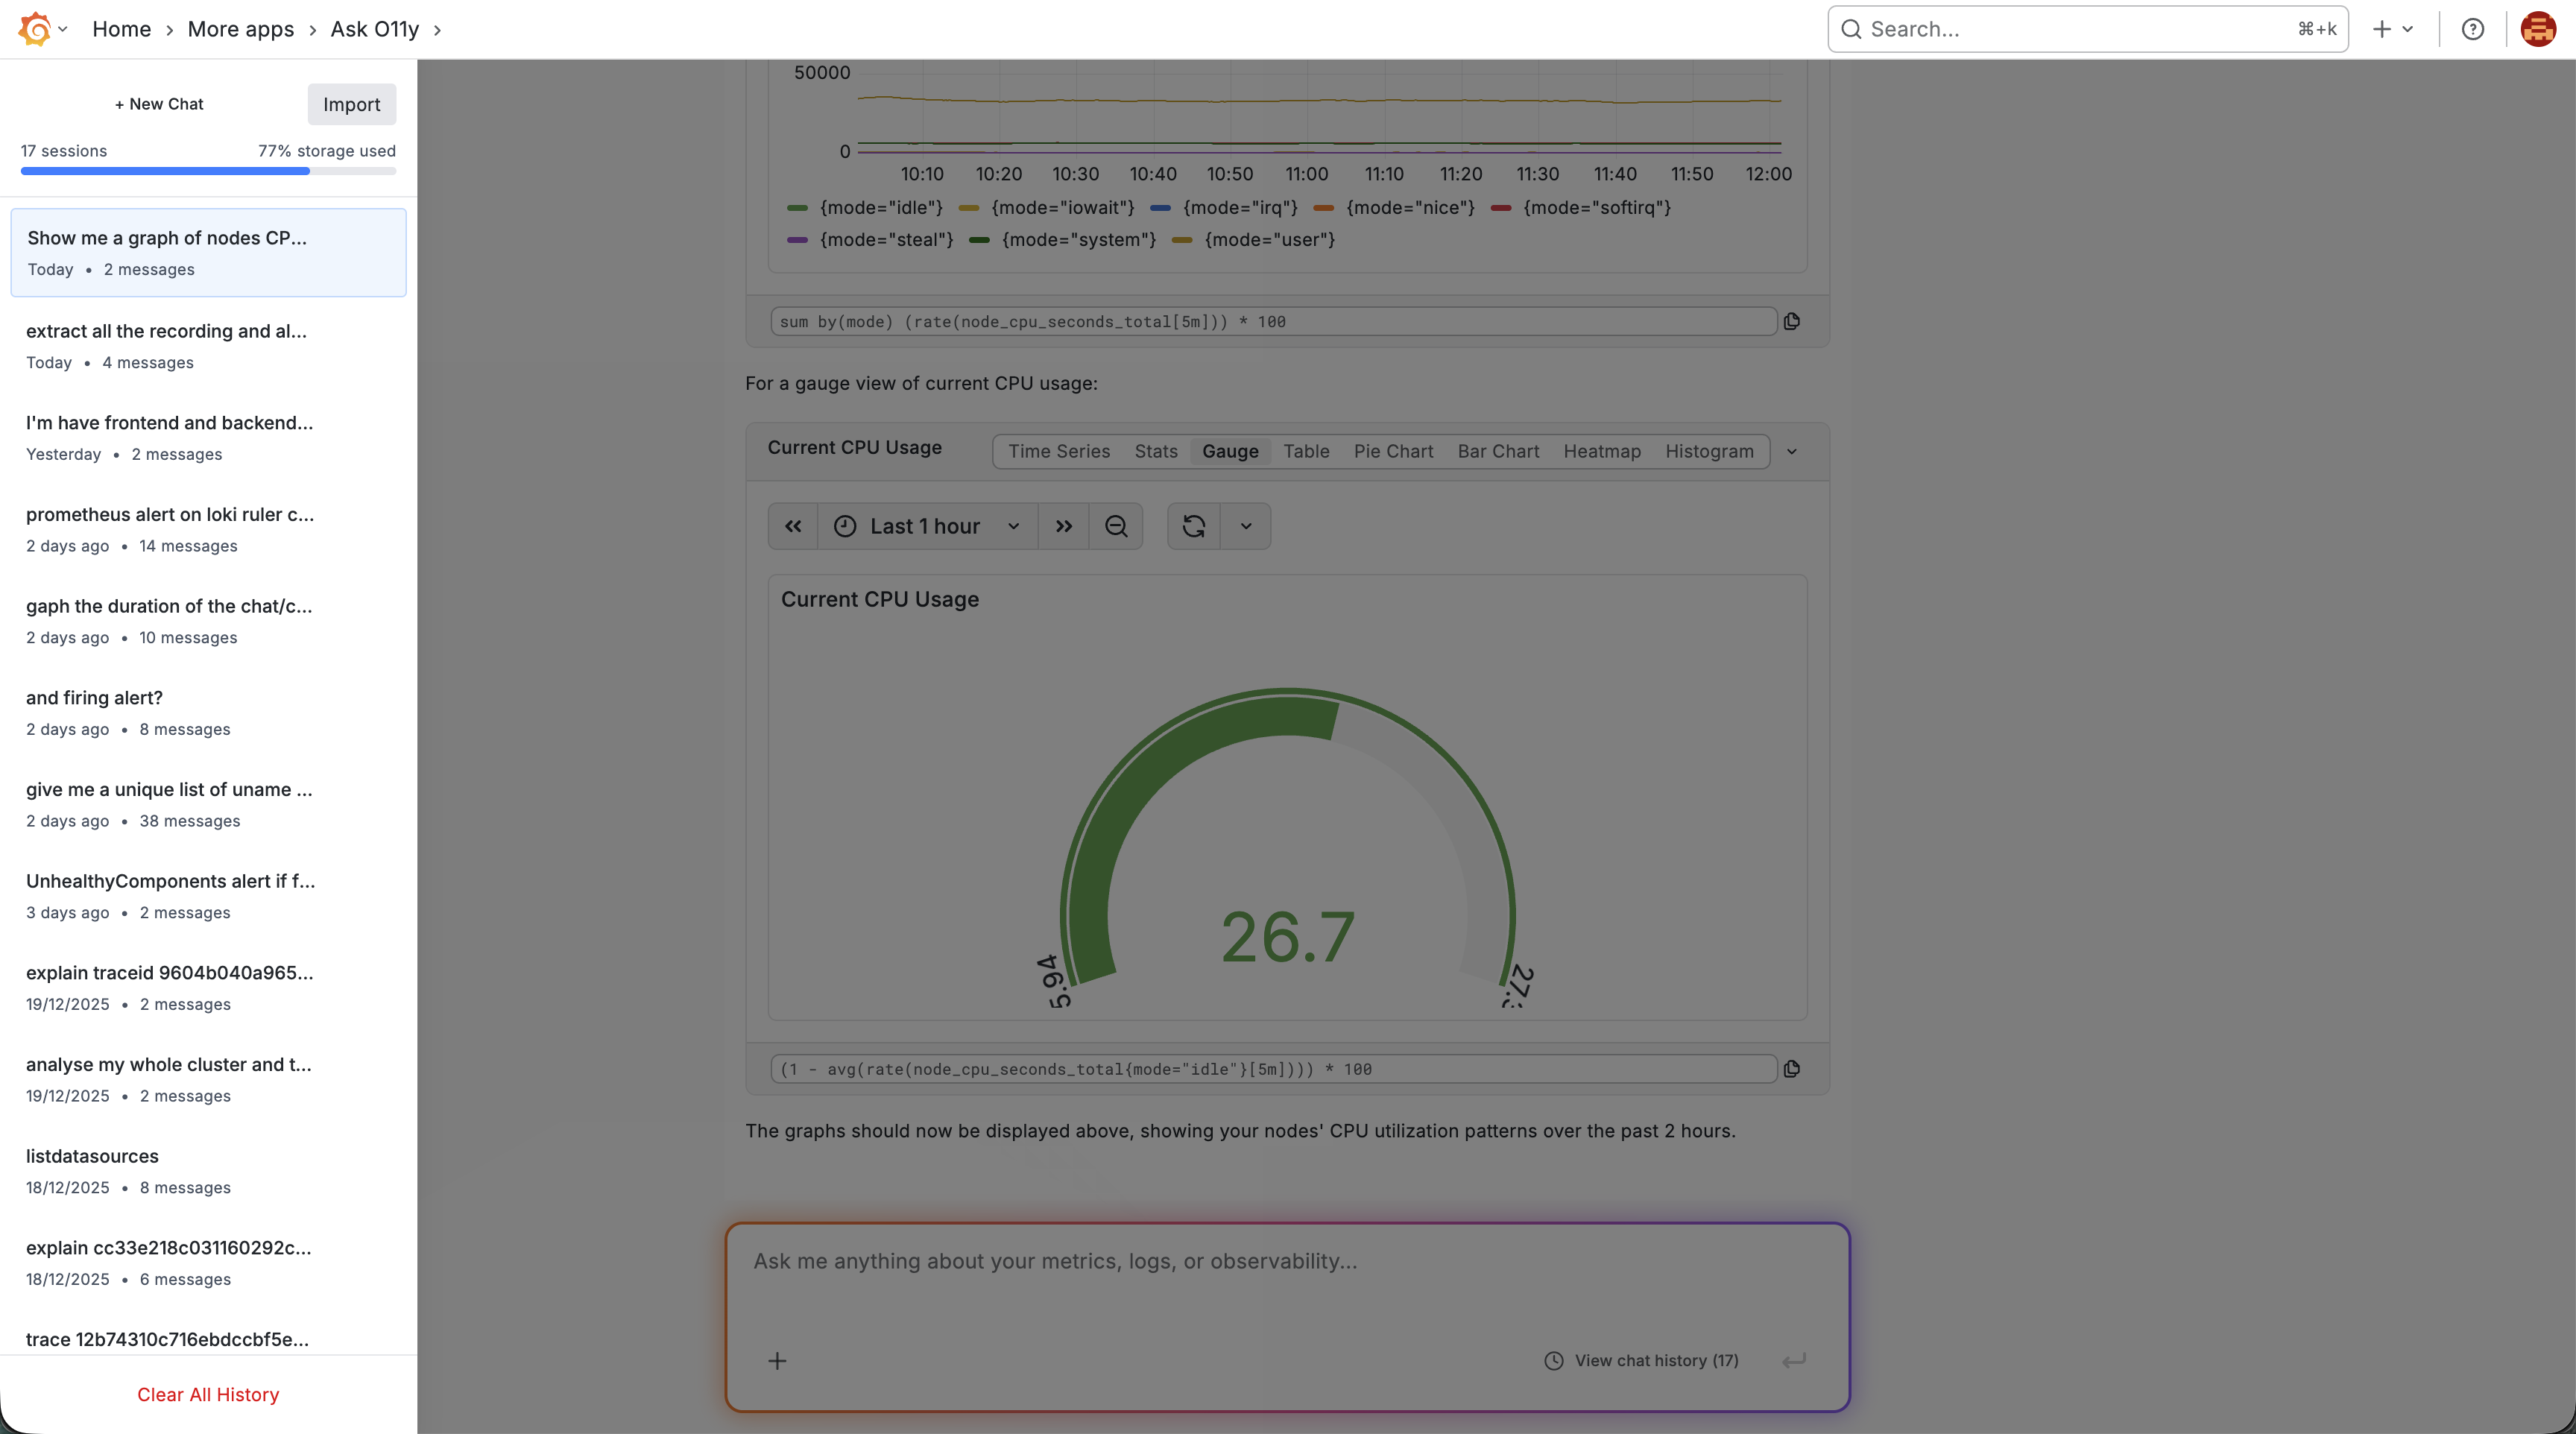
8 chart types with on-the-fly switching: Time Series, Stats, Gauge, Table, Pie Chart, Bar Chart, Heatmap, Histogram.
Role-Based Access Control
- Admin/Editor: Full access to all tools
- Viewer: Read-only access
Permissions are enforced on every operation.
Session Management
- Auto-save conversations
- Browse and resume history
- Share with expiration dates (1h, 1d, 7d, 30d, 90d, or never)
- Import shared sessions to your own account
Alert Investigation
Add investigation links to alert notifications for one-click root cause analysis:
/a/consensys-asko11y-app?type=investigation&alertName={alertName}
Configuration
Access at Configuration → Plugins → Ask O11y → Configuration (Admin only).
LLM Settings
Configure maximum tokens for LLM requests (default: 180,000, range: 1,000–200,000).
MCP Server Management
Add external MCP servers with per-server name, URL, type, authentication headers, and enable/disable toggles. Health status is shown for each server.
Prompt Templates
Customize three prompts: System Prompt (base AI instructions), Investigation Prompt (alert investigation template), and Performance Prompt (performance analysis template). Each can be edited or reset to defaults.
Display Settings
- Kiosk Mode: Hide Grafana navigation bars in embedded pages (on by default)
- Chat Panel Position: Left or right (right by default)
REST API
Ask O11y exposes a REST API for programmatic access. The OpenAPI 3.0.3 spec is served at /api/plugins/consensys-asko11y-app/resources/openapi.json.
For the full endpoint reference, see the REST API Reference in the contributing guide.
Troubleshooting
See TROUBLESHOOTING.md for help with:
- Grafana Cloud issues
- Self-hosted / Docker issues
- Common problems (plugin not responding, permissions, visualizations, session sharing)
Getting Help
- Bug Reports: GitHub Issues
- Discussions: GitHub Discussions
- Security Issues: Use GitHub Security Advisory (private disclosure)
License
MIT License - see LICENSE for details.
Grafana Cloud Free
- Free tier: Limited to 3 users
- Paid plans: $55 / user / month above included usage
- Access to all Enterprise Plugins
- Fully managed service (not available to self-manage)
Self-hosted Grafana Enterprise
- Access to all Enterprise plugins
- All Grafana Enterprise features
- Self-manage on your own infrastructure
Installing Ask O11y on Grafana Cloud:
Installing plugins on a Grafana Cloud instance is a one-click install; same with updates. Cool, right?
Note that it could take up to 1 minute to see the plugin show up in your Grafana.
Warning
Plugin installation from this page will be removed in February 2026. Use the Plugin Catalog in your Grafana instance instead. Refer to Install a plugin in the Grafana documentation for more information.
Installing plugins on a Grafana Cloud instance is a one-click install; same with updates. Cool, right?
Note that it could take up to 1 minute to see the plugin show up in your Grafana.
Installing plugins on a Grafana Cloud instance is a one-click install; same with updates. Cool, right?
Note that it could take up to 1 minute to see the plugin show up in your Grafana.
Warning
Plugin installation from this page will be removed in February 2026. Use the Plugin Catalog in your Grafana instance instead. Refer to Install a plugin in the Grafana documentation for more information.
Installing plugins on a Grafana Cloud instance is a one-click install; same with updates. Cool, right?
Note that it could take up to 1 minute to see the plugin show up in your Grafana.
For more information, visit the docs on plugin installation.
Installing on a local Grafana:
For local instances, plugins are installed and updated via a simple CLI command. Plugins are not updated automatically, however you will be notified when updates are available right within your Grafana.
1. Install the Application
Use the grafana-cli tool to install Ask O11y from the commandline:
grafana-cli plugins install The plugin will be installed into your grafana plugins directory; the default is /var/lib/grafana/plugins. More information on the cli tool.
Alternatively, you can manually download the .zip file for your architecture below and unpack it into your grafana plugins directory.
Alternatively, you can manually download the .zip file and unpack it into your grafana plugins directory.
2. Enable it
Next, log into your Grafana instance. Navigate to the Plugins section, found in your Grafana main menu.
Click the Apps tabs in the Plugins section and select the newly installed app.
To enable the app, click the Config tab. Follow the instructions provided with the application and click Enable. The app and any new UI pages are now accessible from within the main menu, as designed by the app creator.
If dashboards have been included with the application, they will attempt to be automatically installed. To view the dashboards, re-import or delete individual dashboards, click the Dashboards tab within the app page.
Changelog
All notable changes to the Ask O11y Grafana plugin will be documented in this file.
The format is based on Keep a Changelog, and this project adheres to Semantic Versioning.
0.2.21 (2026-04-07)
Bug Fixes
0.2.20 (2026-04-02)
Features
0.2.19 (2026-04-01)
Features
0.2.18 (2026-03-30)
Features
Bug Fixes
[Unreleased]
Fixed
- viz: resolve Prometheus, Loki, and Tempo datasources like Grafana defaults (and optional
dsUID on code fences) instead of hardcoded names (#104)
0.2.17 (2026-03-13)
Features
- add attestation to artifact (#2) (99b0a07)
- add custom loader with style (#17) (5b4abcc)
- add Right Side Panel (#3) (9bbf7c7)
- agent: server-side agentic loop with detached execution and E2E test consolidation (#46) (c5fbe29)
- agent: use alert runbook annotation during investigation (#57) (3f1bc5d)
- backend: move agent loop logic server-side with template system and PromptEditor UI (#53) (f50ff9a)
- chat: add alert investigation mode for one-click RCA (#29) (a0f129e)
- chat: add OTEL tracing and Tempo to the agent loop (#82) (4037b68)
- config: store MCP server headers and Redis URL in secureJsonData (#86) (1038a49)
- get ready for first release (#1) (bdd4c98)
- store sessions in the backend (#6) (4825a8e)
- use scene for split view (#15) (62a8f4b)
Bug Fixes
- add orgID to share urls (#18) (b08a530)
- allow plugin signing (a52542c)
- allow signing (a6e75ad)
- backend: address Grafana review feedback for Go code quality (#64) (57b42f1)
- backend: fix unreliable session history in multi-replica Grafana deployments (#69) (876e939)
- backend: make SA token fetch non-fatal and sanitize HTTP error messages (#90) (9c14ba6)
- build: filter node_modules from Go manifest (#71) (881d928)
- chat: add SSE idle timeout and allow new chat during generation (#62) (954437c)
- chat: fix autoscroll not triggering after user scrolls up (#78) (4d4c618)
- ci: add fast-pass for release-please PRs (49de748)
- ci: add workflow_dispatch trigger (75c59b4)
- ci: allow 'main' scope for release-please PRs (7aa127b)
- ci: make release-please PRs mergeable by skipping CI for non-code changes (#35) (73b1bea)
- ci: remove package.json from paths filter (05ab8b4)
- config: enhance claude setup (7d76956)
- deps: pin flatted to 3.3.3 to exclude Go files from manifest (#75) (c458ef4)
- mcp: namespace mcp-tool-settings localStorage key with plugin ID (#83) (a1e8eef)
- plugin: change per-request MCP log statements from Info to Debug (#84) (dd8f4a3)
- release: use PAT for release-please and skip GitHub Release creation (#37) (fc6014a)
- release: use simple tag format (v0.2.5 not ask-o11y-plugin-v0.2.5) (e84de65)
- share banner and limit tabs (#19) (51b491d)
- side panel disappearing after each new question (#16) (527287d)
- side-panel: open panel when links appear after session load or hard refresh (#79) (fb4d87d)
- ui: remove all console.* calls from shipped frontend code (#91) (61f59a1)
- ui: replace hardcoded colors and fixed pixel widths with Grafana theme abstractions (#87) (5f64b38)
- ui: resolve chat UX issues and frontend code quality (#66) (5ec62dc)
- version (#28) (0f9b584)
Reverts
0.2.16 (2026-03-13)
Bug Fixes
0.2.15 (2026-03-12)
Bug Fixes
- backend: make SA token fetch non-fatal and sanitize HTTP error messages (#90) (9c14ba6)
- ui: remove all console.* calls from shipped frontend code (#91) (61f59a1)
0.2.14 (2026-03-11)
Features
- chat: add OTEL tracing and Tempo to the agent loop (#82) (4037b68)
- config: store MCP server headers and Redis URL in secureJsonData (#86) (1038a49)
Bug Fixes
- chat: add SSE idle timeout and allow new chat during generation (#62) (954437c)
- mcp: namespace mcp-tool-settings localStorage key with plugin ID (#83) (a1e8eef)
- plugin: change per-request MCP log statements from Info to Debug (#84) (dd8f4a3)
- ui: replace hardcoded colors and fixed pixel widths with Grafana theme abstractions (#87) (5f64b38)
0.2.13 (2026-03-09)
Bug Fixes
- chat: fix autoscroll not triggering after user scrolls up (#78) (4d4c618)
- side-panel: open panel when links appear after session load or hard refresh (#79) (fb4d87d)
0.2.12 (2026-03-06)
Bug Fixes
0.2.11 (2026-03-06)
Bug Fixes
Reverts
0.2.10 (2026-03-04)
Bug Fixes
0.2.9 (2026-03-03)
Features
Bug Fixes
- backend: address Grafana review feedback for Go code quality (#64) (57b42f1)
- ui: resolve chat UX issues and frontend code quality (#66) (5ec62dc)
0.2.8 (2026-02-18)
Features
0.2.7 (2026-02-14)
Features
Bug Fixes
- config: enhance claude setup (7d76956)
0.2.6 (2026-02-06)
Features
- add attestation to artifact (#2) (99b0a07)
- add custom loader with style (#17) (5b4abcc)
- add Right Side Panel (#3) (9bbf7c7)
- chat: add alert investigation mode for one-click RCA (#29) (a0f129e)
- get ready for first release (#1) (bdd4c98)
- store sessions in the backend (#6) (4825a8e)
- use scene for split view (#15) (62a8f4b)
Bug Fixes
- add orgID to share urls (#18) (b08a530)
- ci: add fast-pass for release-please PRs (49de748)
- ci: add workflow_dispatch trigger (75c59b4)
- ci: allow 'main' scope for release-please PRs (7aa127b)
- ci: make release-please PRs mergeable by skipping CI for non-code changes (#35) (73b1bea)
- ci: remove package.json from paths filter (05ab8b4)
- release: use PAT for release-please and skip GitHub Release creation (#37) (fc6014a)
- release: use simple tag format (v0.2.5 not ask-o11y-plugin-v0.2.5) (e84de65)
- share banner and limit tabs (#19) (51b491d)
- side panel disappearing after each new question (#16) (527287d)
- version (#28) (0f9b584)
0.2.5 (2026-02-06)
Features
- add attestation to artifact (#2) (99b0a07)
- add custom loader with style (#17) (5b4abcc)
- add Right Side Panel (#3) (9bbf7c7)
- chat: add alert investigation mode for one-click RCA (#29) (a0f129e)
- get ready for first release (#1) (bdd4c98)
- store sessions in the backend (#6) (4825a8e)
- use scene for split view (#15) (62a8f4b)
Bug Fixes
- add orgID to share urls (#18) (b08a530)
- ci: add fast-pass for release-please PRs (49de748)
- ci: add workflow_dispatch trigger (75c59b4)
- ci: allow 'main' scope for release-please PRs (7aa127b)
- ci: make release-please PRs mergeable by skipping CI for non-code changes (#35) (73b1bea)
- ci: remove package.json from paths filter (05ab8b4)
- release: use simple tag format (v0.2.5 not ask-o11y-plugin-v0.2.5) (e84de65)
- share banner and limit tabs (#19) (51b491d)
- side panel disappearing after each new question (#16) (527287d)
- version (#28) (0f9b584)
0.2.4 (2026-02-05)
Features
- add attestation to artifact (#2) (99b0a07)
- add custom loader with style (#17) (5b4abcc)
- add Right Side Panel (#3) (9bbf7c7)
- chat: add alert investigation mode for one-click RCA (#29) (a0f129e)
- get ready for first release (#1) (bdd4c98)
- store sessions in the backend (#6) (4825a8e)
- use scene for split view (#15) (62a8f4b)
Bug Fixes
- add orgID to share urls (#18) (b08a530)
- ci: add fast-pass for release-please PRs (49de748)
- ci: allow 'main' scope for release-please PRs (7aa127b)
- share banner and limit tabs (#19) (51b491d)
- side panel disappearing after each new question (#16) (527287d)
- version (#28) (0f9b584)
0.1.0 - 2026-01-XX
Initial release of Ask O11y - AI-powered observability assistant for Grafana.
Added
Core Features
- Natural Language Query Interface: Conversational AI assistant for querying metrics, logs, and traces
- Real-time Streaming Responses: Live LLM responses with tool execution status updates
- Interactive Visualizations: 8 chart types (time series, stats, gauge, table, pie, bar, heatmap, histogram)
- On-the-fly Visualization Switching: Change chart types without re-running queries
- Session Management: Persistent chat sessions with localStorage support
- Quick Suggestions: Context-aware query suggestions based on Grafana environment
MCP Integration
- Model Context Protocol Support: Integration with MCP servers for extensible tool capabilities
- 56+ Grafana Tools: Complete dashboard, datasource, alerting, and query management
- Multiple Transport Types: Standard MCP, OpenAPI/REST, SSE streaming, HTTP streamable
- Dynamic Tool Discovery: Automatic detection of available tools from configured MCP servers
- Multi-server Aggregation: Proxy and aggregate tools from multiple MCP servers
Security & Access Control
- Role-Based Access Control (RBAC): Admin/Editor full access (56 tools), Viewer read-only (45 tools)
- Multi-tenant Organization Isolation: Secure data isolation per user, with sessions organized by organization
- Grafana Permission Integration: Respects existing Grafana datasource permissions
- Secure Credential Storage: Integration with Grafana's secure storage mechanisms
Visualization Features
- Time Range Controls: Built-in time picker with common presets
- Auto-refresh: Configurable intervals from 5 seconds to 1 hour
- Query Export: Copy PromQL/LogQL/TraceQL queries to clipboard
- Theme Support: Automatic light/dark theme integration
- Expandable Charts: Full-screen chart analysis mode
- Responsive Design: Mobile and desktop optimized layouts
Developer Experience
- TypeScript: Strict type checking with comprehensive type definitions
- React 18: Modern React with hooks and functional components
- Tailwind CSS: Utility-first styling with Grafana theme integration
- Go Backend: High-performance MCP proxy server
- Comprehensive Testing: Unit tests (Jest), E2E tests (Playwright), Go tests
- Hot Module Reload: Fast development workflow with webpack dev server
Data Source Support
- Prometheus: PromQL query execution with metric visualization
- Loki: LogQL query execution with log exploration
- Tempo: TraceQL query execution with trace analysis
- Generic Datasources: Query any Grafana datasource through natural language
Tool Categories
- Datasource Operations: Query, list, test connectivity, health checks
- Dashboard Management: Create, update, delete, search, star, snapshot
- Alert Management: Configure alerts, silences, notification channels, contact points
- Query Execution: Run queries with automatic visualization
- Resource Discovery: Search and explore Grafana resources
- Panel Operations: Manage dashboard panels and visualizations
- Folder Management: Organize dashboards with folder operations
- User Management: Query user information and permissions
Technical Details
Frontend Stack
- React 18.2.0 with TypeScript 5.5.4
- Grafana UI Components (@grafana/ui, @grafana/data, @grafana/scenes)
- Tailwind CSS 4.1.12 for styling
- RxJS 7.8.2 for reactive state management
- Model Context Protocol SDK (@modelcontextprotocol/sdk)
Backend Stack
- Go 1.23+ with Grafana Plugin SDK
- MCP Go SDK for server integration
- Multi-transport proxy server
- Health monitoring and connection management
Build & CI/CD
- Webpack 5 for frontend bundling
- Mage for Go build automation
- Multi-platform builds (Linux amd64/arm64, macOS amd64/arm64, Windows amd64)
- GitHub Actions CI/CD pipeline
- Automated testing and validation
- Plugin signing support
Supported Grafana Versions
- Minimum: Grafana 12.1.1
- Tested: Grafana 12.x and Enterprise editions
Dependencies
Plugin Dependencies
- grafana-llm-app: Required for LLM provider integration
Key Libraries
- @grafana/* packages: Core Grafana integration
- @modelcontextprotocol/sdk: MCP client functionality
- js-tiktoken: Token counting for LLM context management
- streamdown: Markdown streaming utilities
Notes
- This is the initial community release
- Requires LLM API key configuration (OpenAI, Anthropic, or compatible provider)
- MCP server configuration required for full functionality
- MIT License