Servers Inventory
The dashboards allows to see amount of monitored servers. Instances are sorted by memory size and CPU Cores.
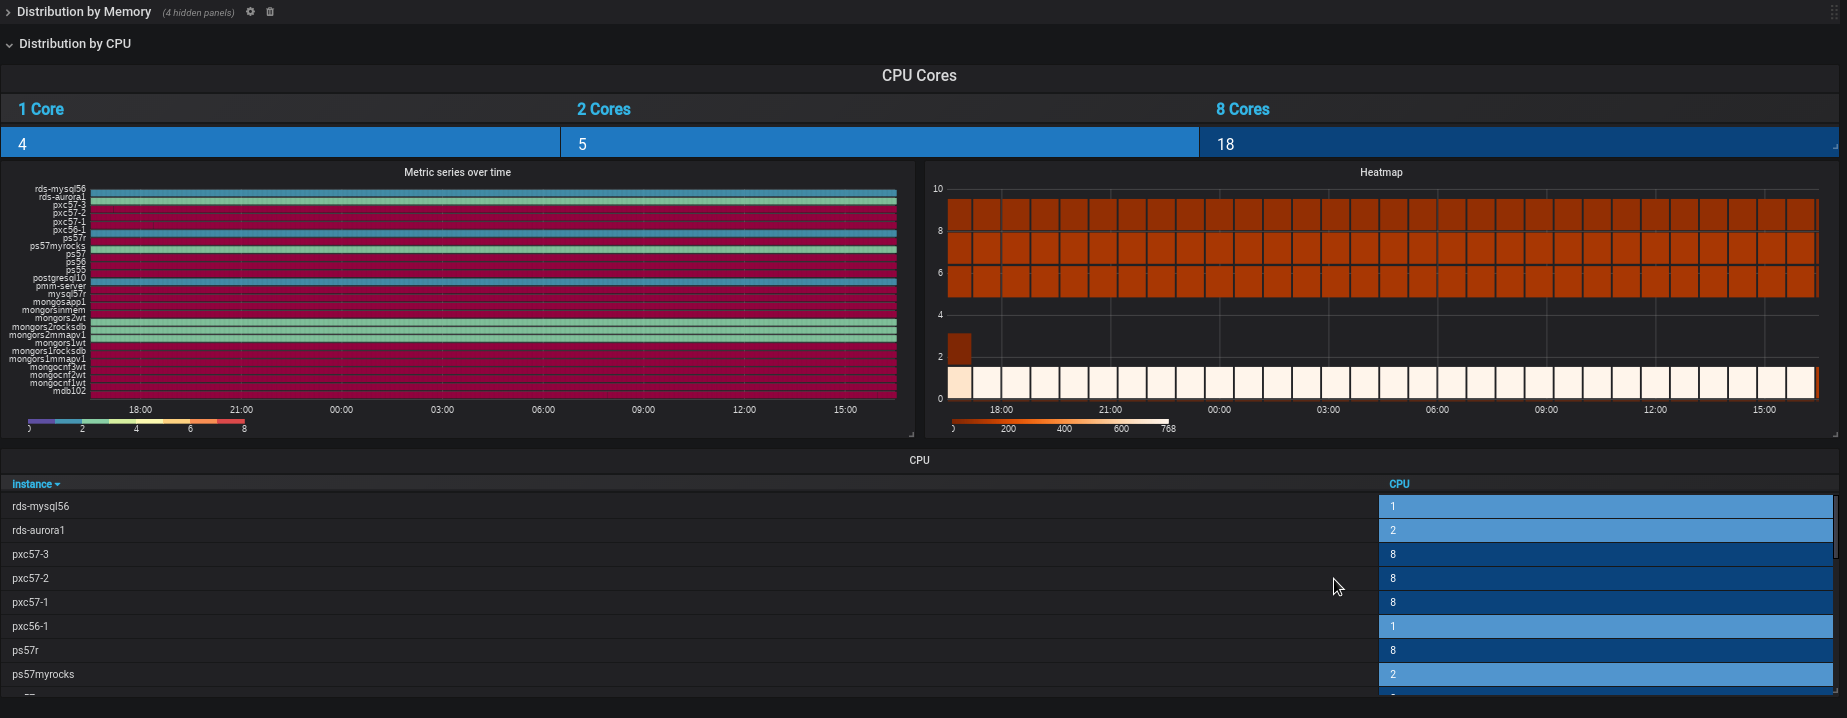
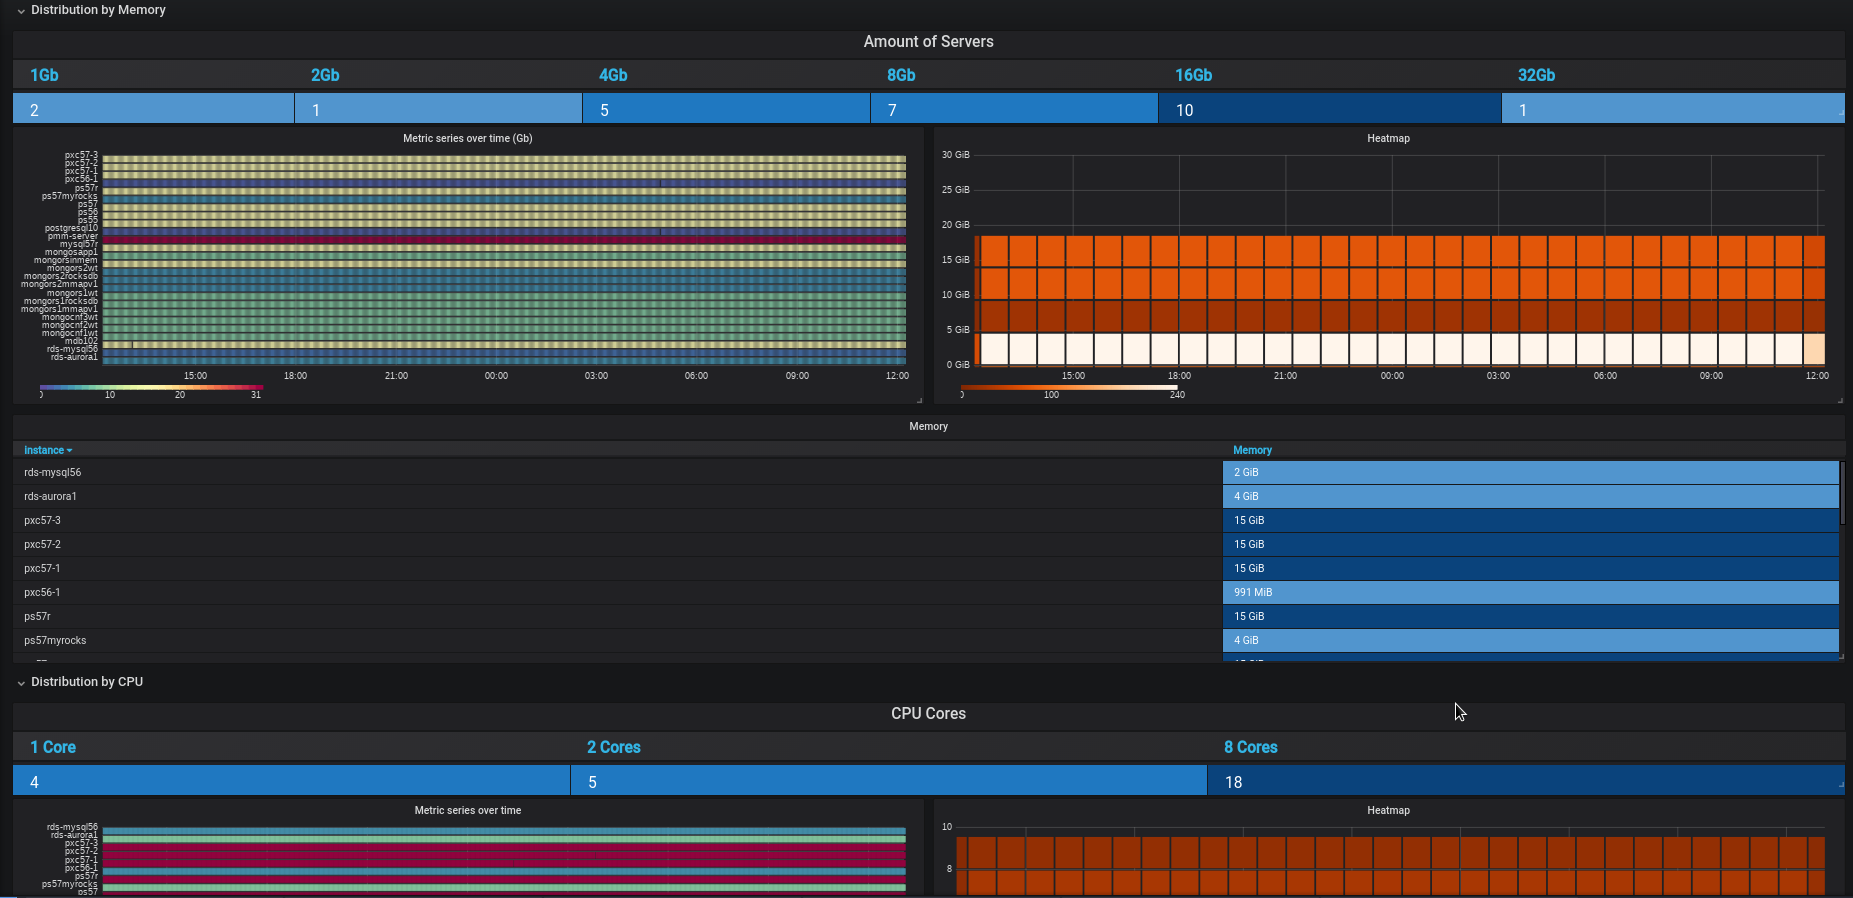
The Servers Inventory dashboard uses the prometheus data source to create a Grafana dashboard with the heatmap and table panels.
Data source config
Collector type:
Collector plugins:
Collector config:
Revisions
Upload an updated version of an exported dashboard.json file from Grafana
| Revision | Description | Created | |
|---|---|---|---|
| Download |