Kubelesss
Dashboard for Kubeless monitoring via Prometheus, shows function calls, failure and duration as well as CPU and Memory usage for kubeless pods (Controller and runtimes)
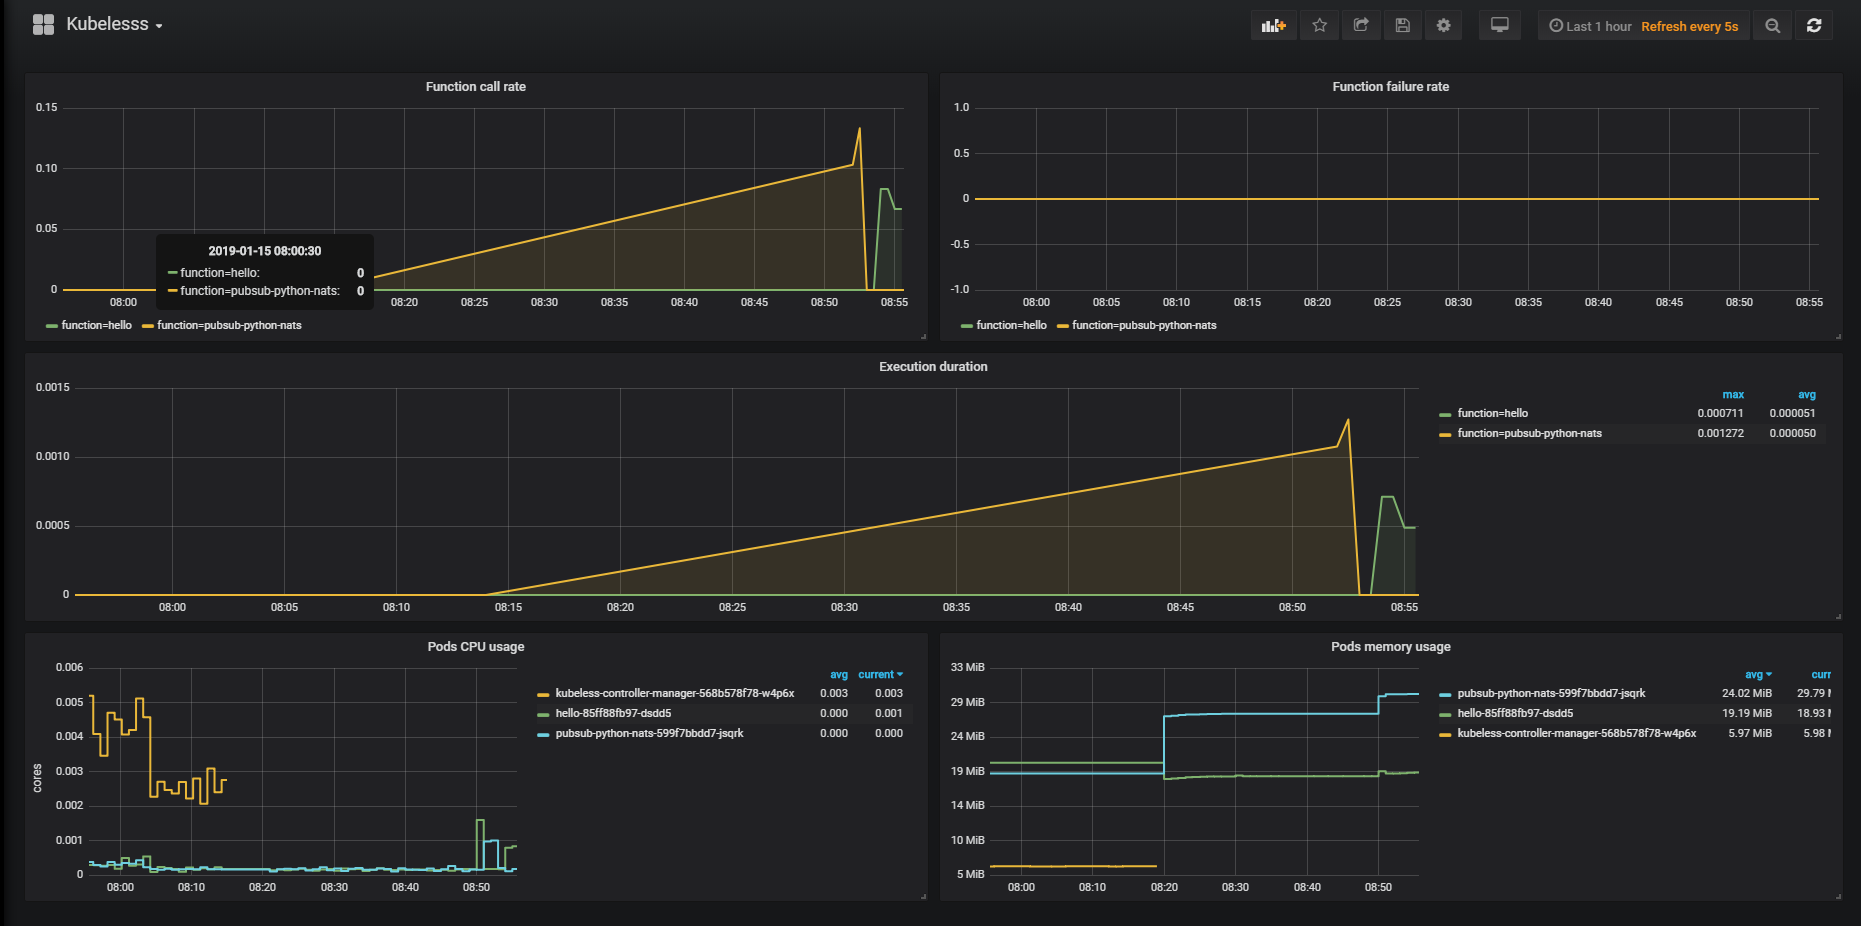
The Kubelesss dashboard uses the prometheus data source to create a Grafana dashboard with the graph panel.
Data source config
Collector type:
Collector plugins:
Collector config:
Revisions
Upload an updated version of an exported dashboard.json file from Grafana
| Revision | Description | Created | |
|---|---|---|---|
| Download |