RaspiBolt System Overview
This Dashboard provides a general overview of a RaspiBolt system, with templating to host and Interval
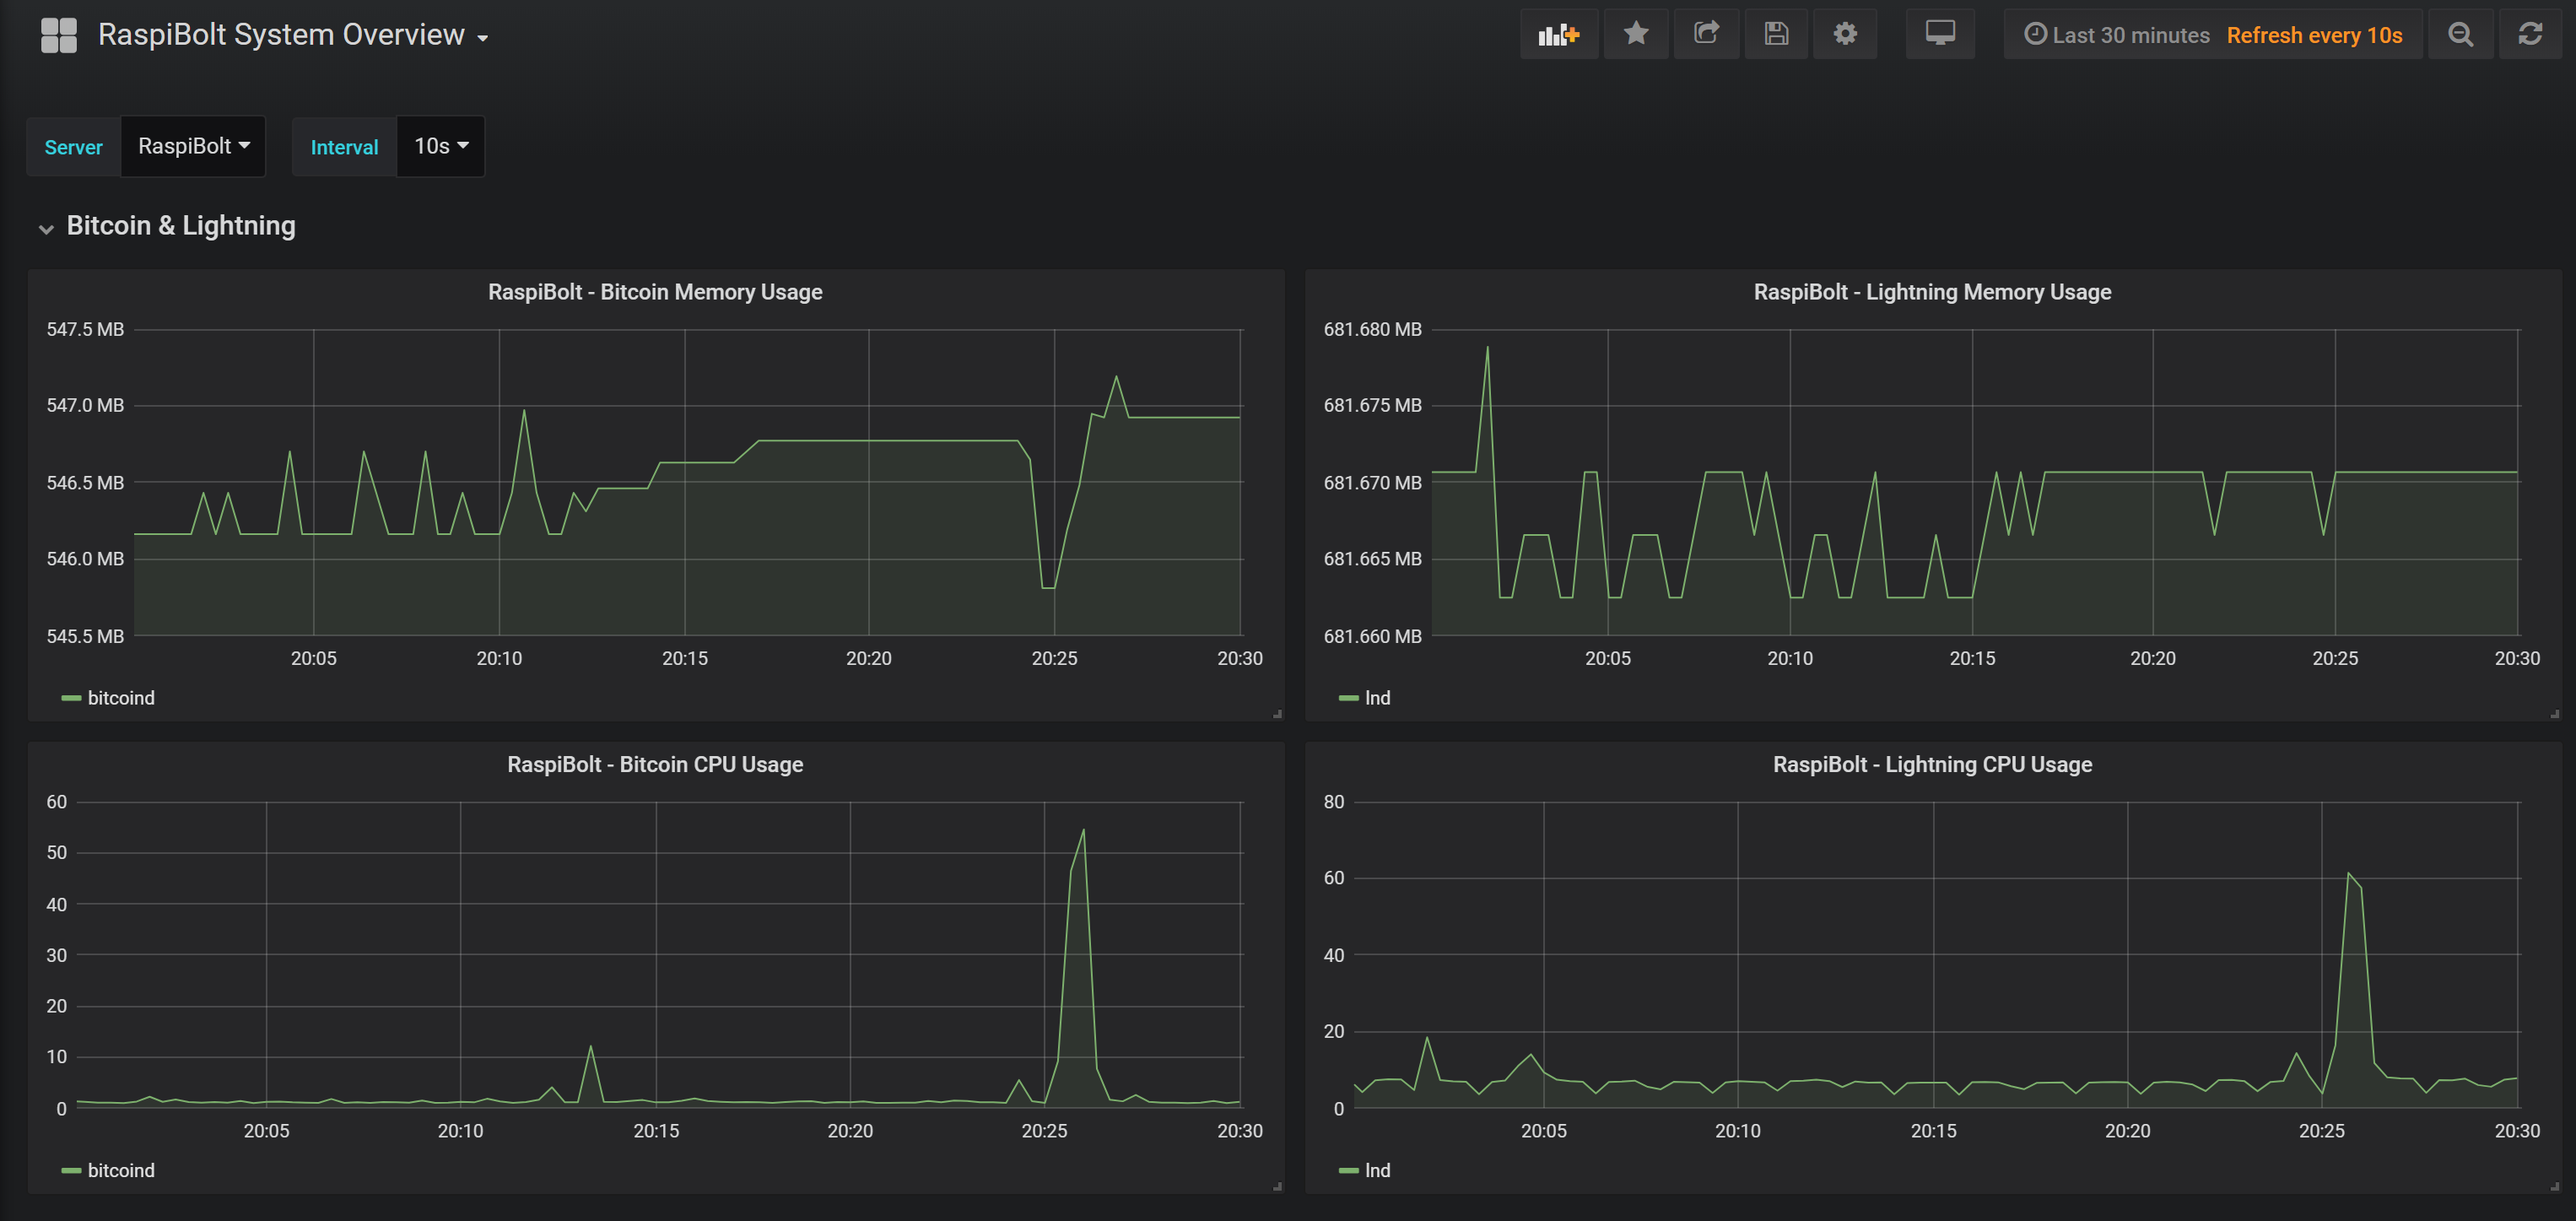
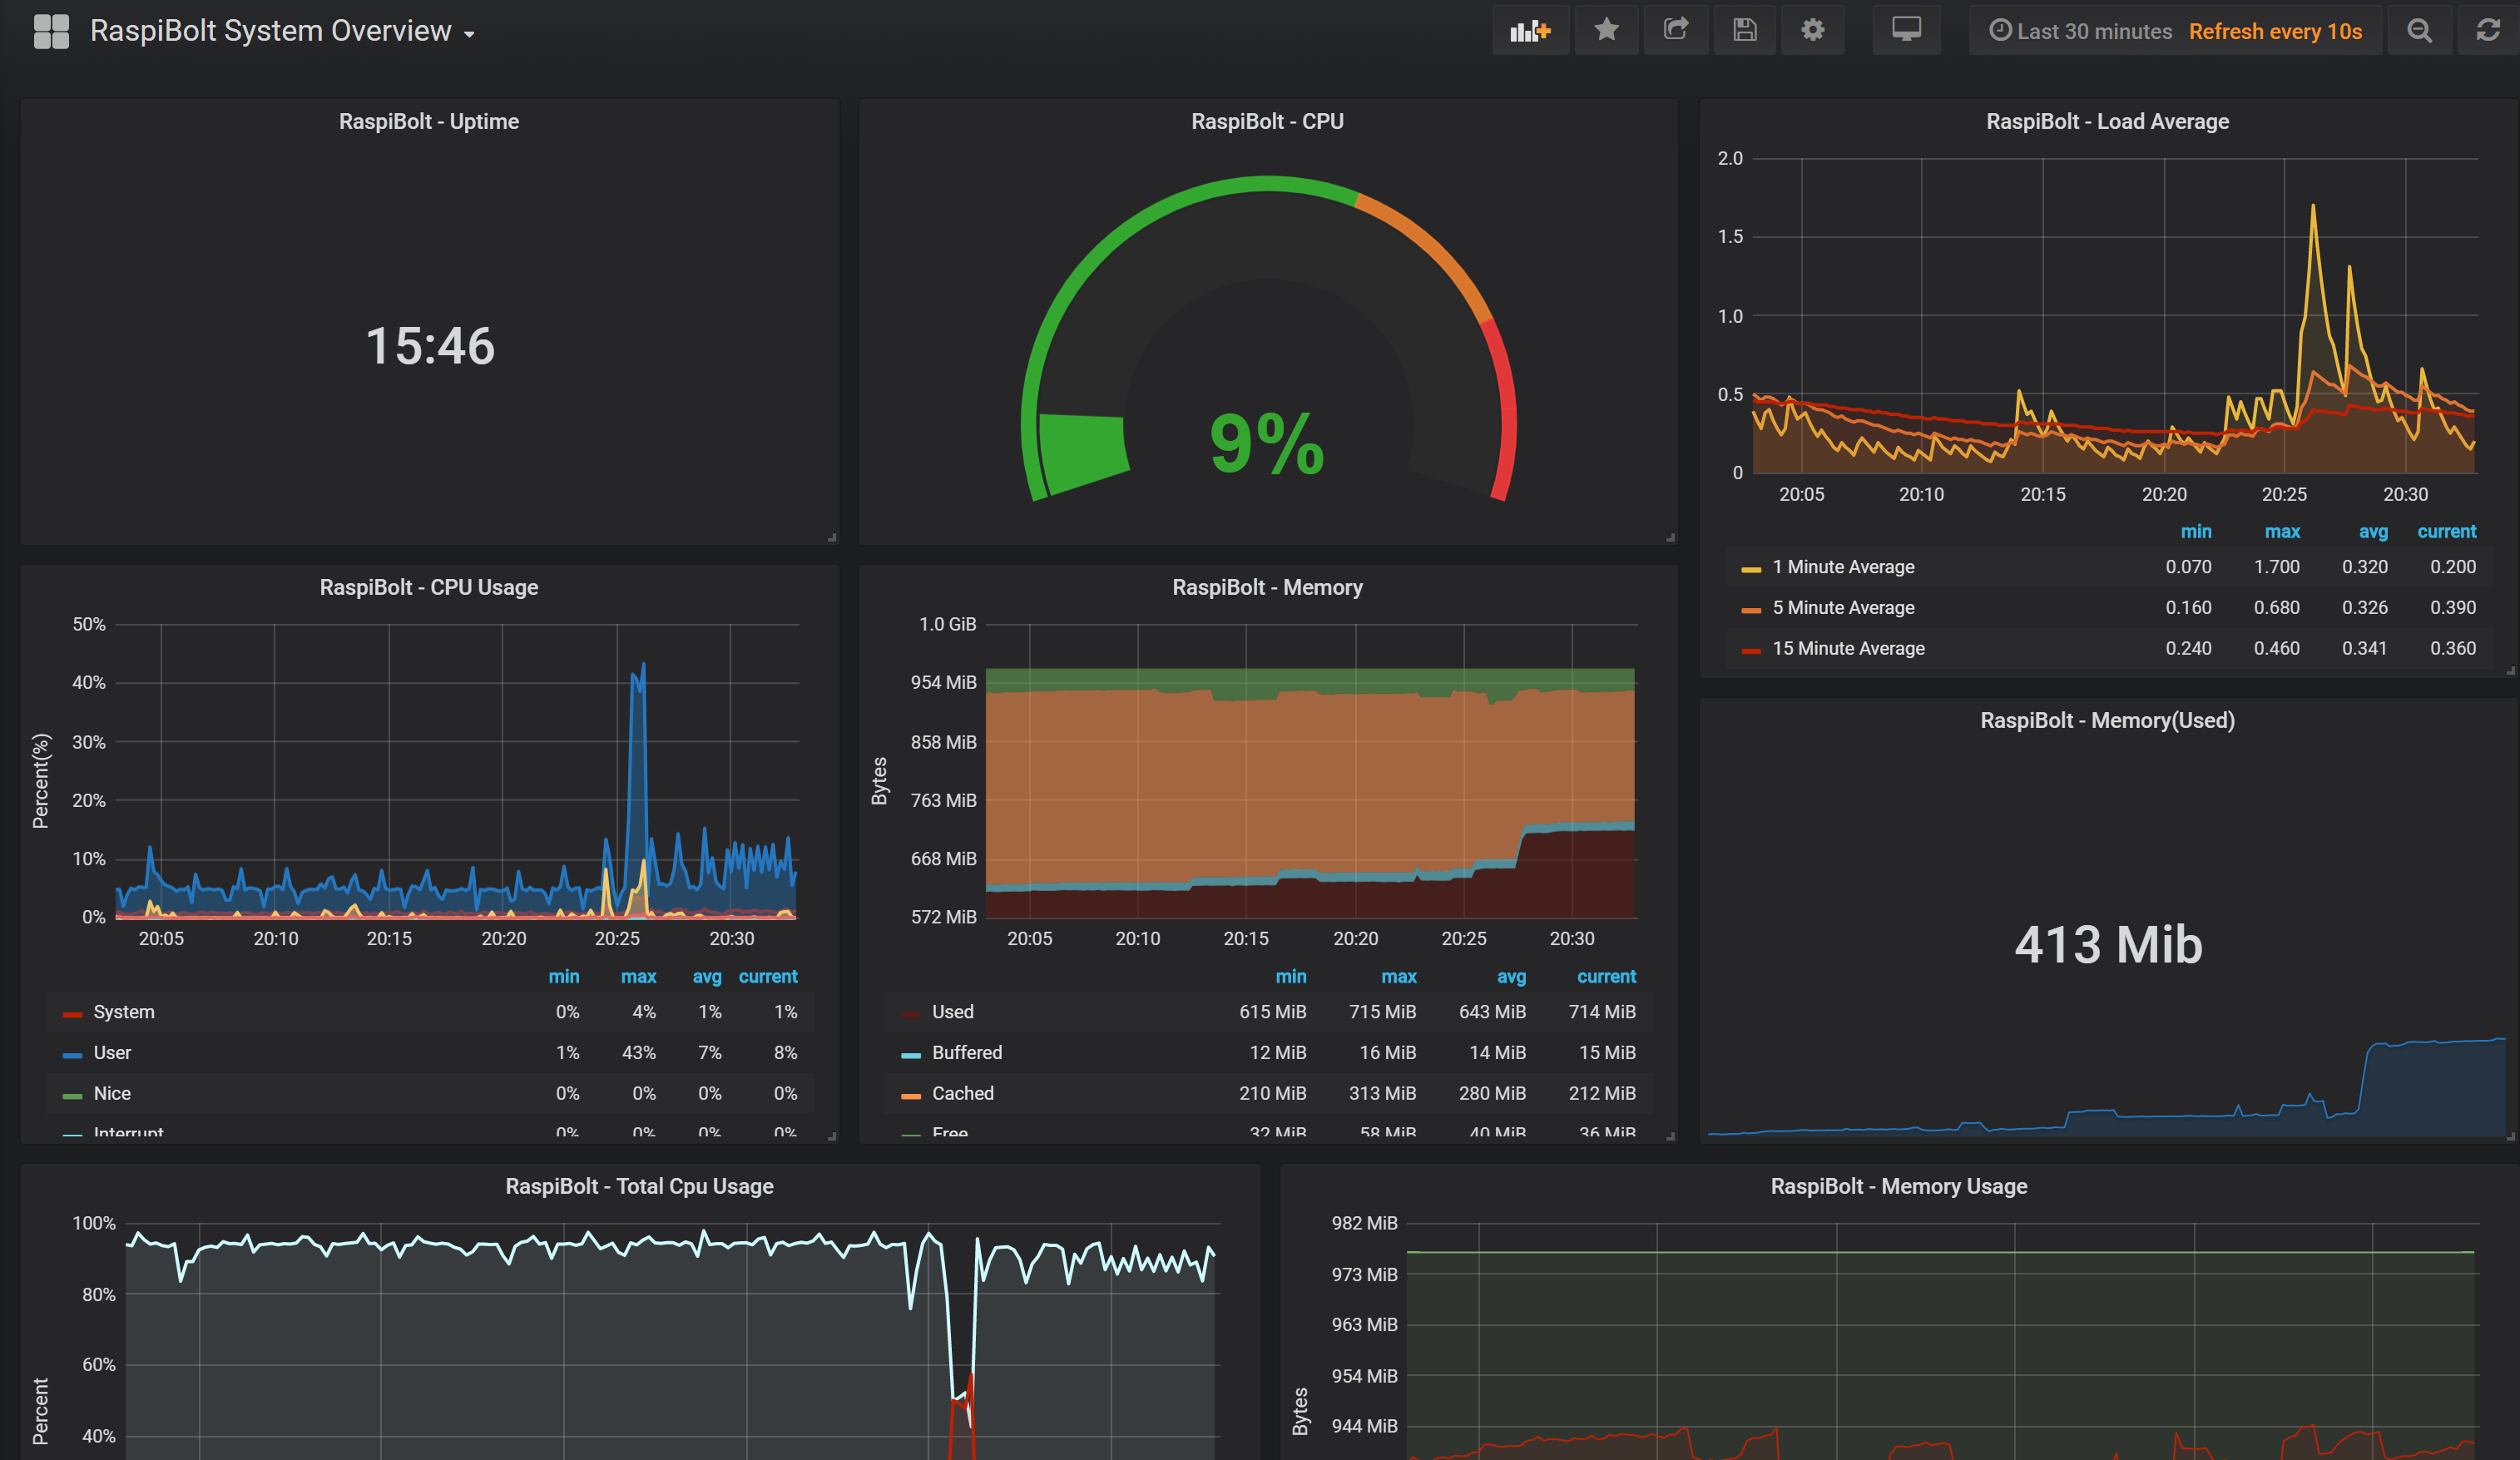
This dashboard goes hand in hand with the guide as outlined in the brilliant RaspiBolt. In particular the Performance Monitoring section
Data source config
Collector type:
Collector plugins:
Collector config:
Revisions
Upload an updated version of an exported dashboard.json file from Grafana
| Revision | Description | Created | |
|---|---|---|---|
| Download |