Celery Monitoring
Celery metrics monitoring from prometheus datasource
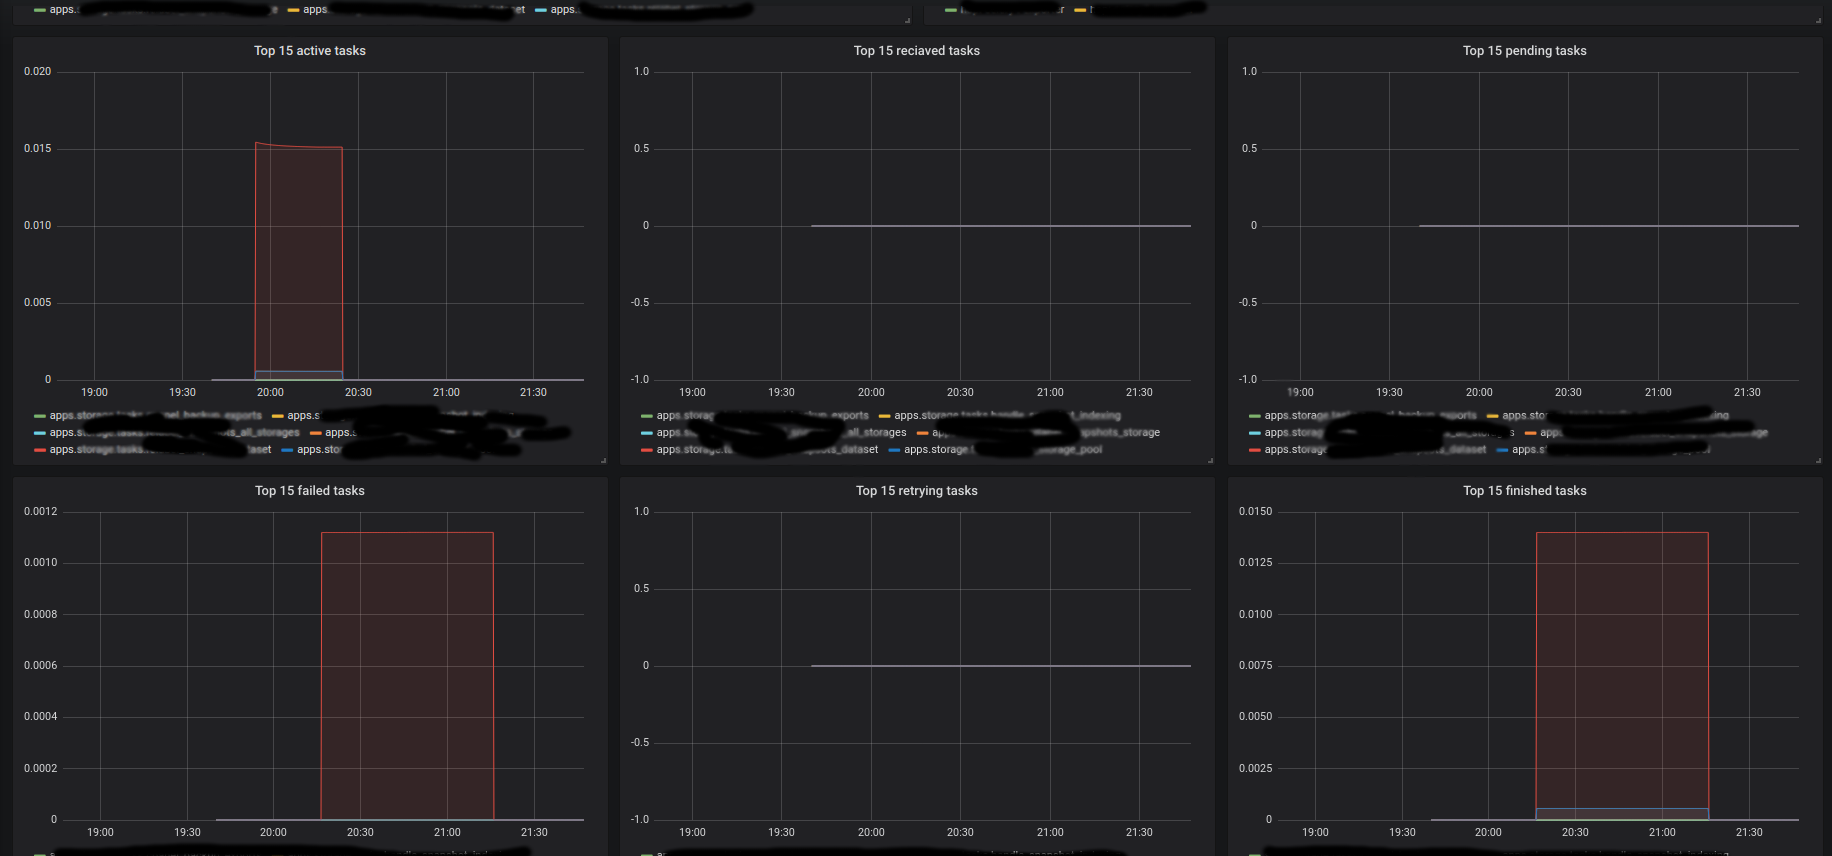
This Dashboard works with celery prom exporter from https://github.com/zerok/celery-prometheus-exporter However, I've adjusted exporter to work from Django config file I think it should not affect main logic.
Data source config
Collector type:
Collector plugins:
Collector config:
Revisions
Upload an updated version of an exported dashboard.json file from Grafana
| Revision | Description | Created | |
|---|---|---|---|
| Download |