LINUX NMON Report
Dashboard to display data collected by nmon (http://nmon.sourceforge.net) . Datasource is influxdb. Data should be loaded to influxdb by nmon2influxdb(https://nmon2influxdb.org)
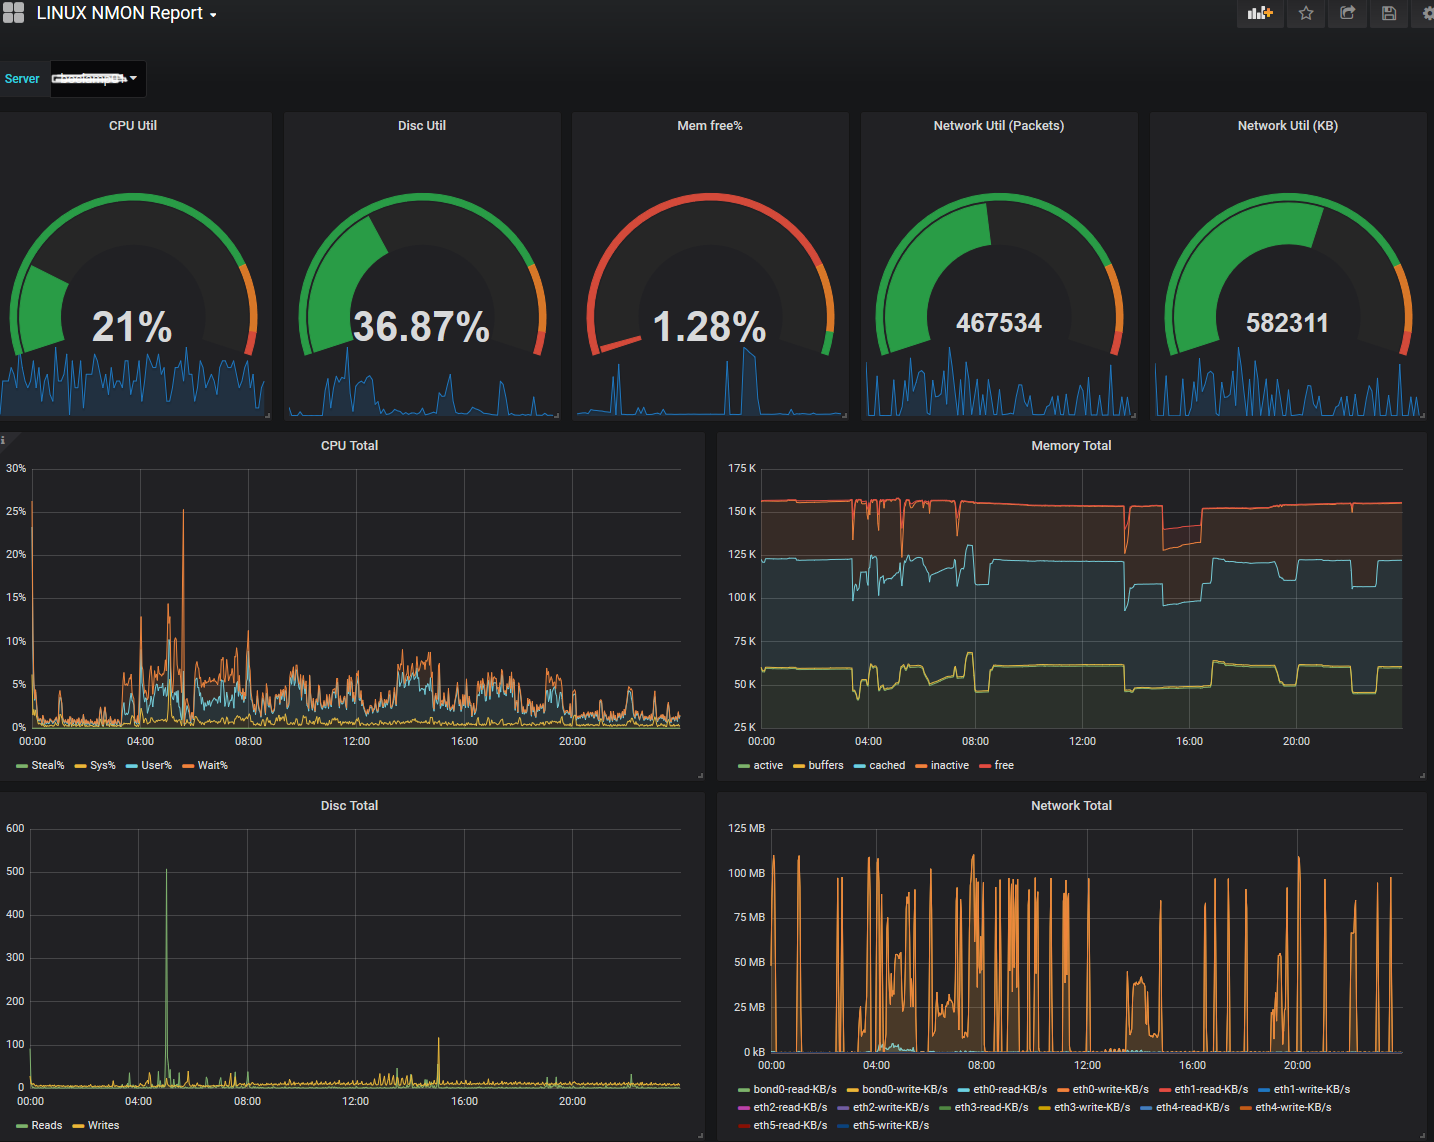
The dashboard contains graphs for cpu, memory, disc and memory utiilization as gauges followed by total graps for these metrics. Data collector is the famous nmon tool, whose data was imported to influxdb by nmon2influxdb tool, which is a really great help.
Any comments are welcome
Data source config
Collector type:
Collector plugins:
Collector config:
Revisions
Upload an updated version of an exported dashboard.json file from Grafana
| Revision | Description | Created | |
|---|---|---|---|
| Download |
Linux Server
Monitor Linux with Grafana. Easily monitor your Linux deployment with Grafana Cloud's out-of-the-box monitoring solution.
Learn more