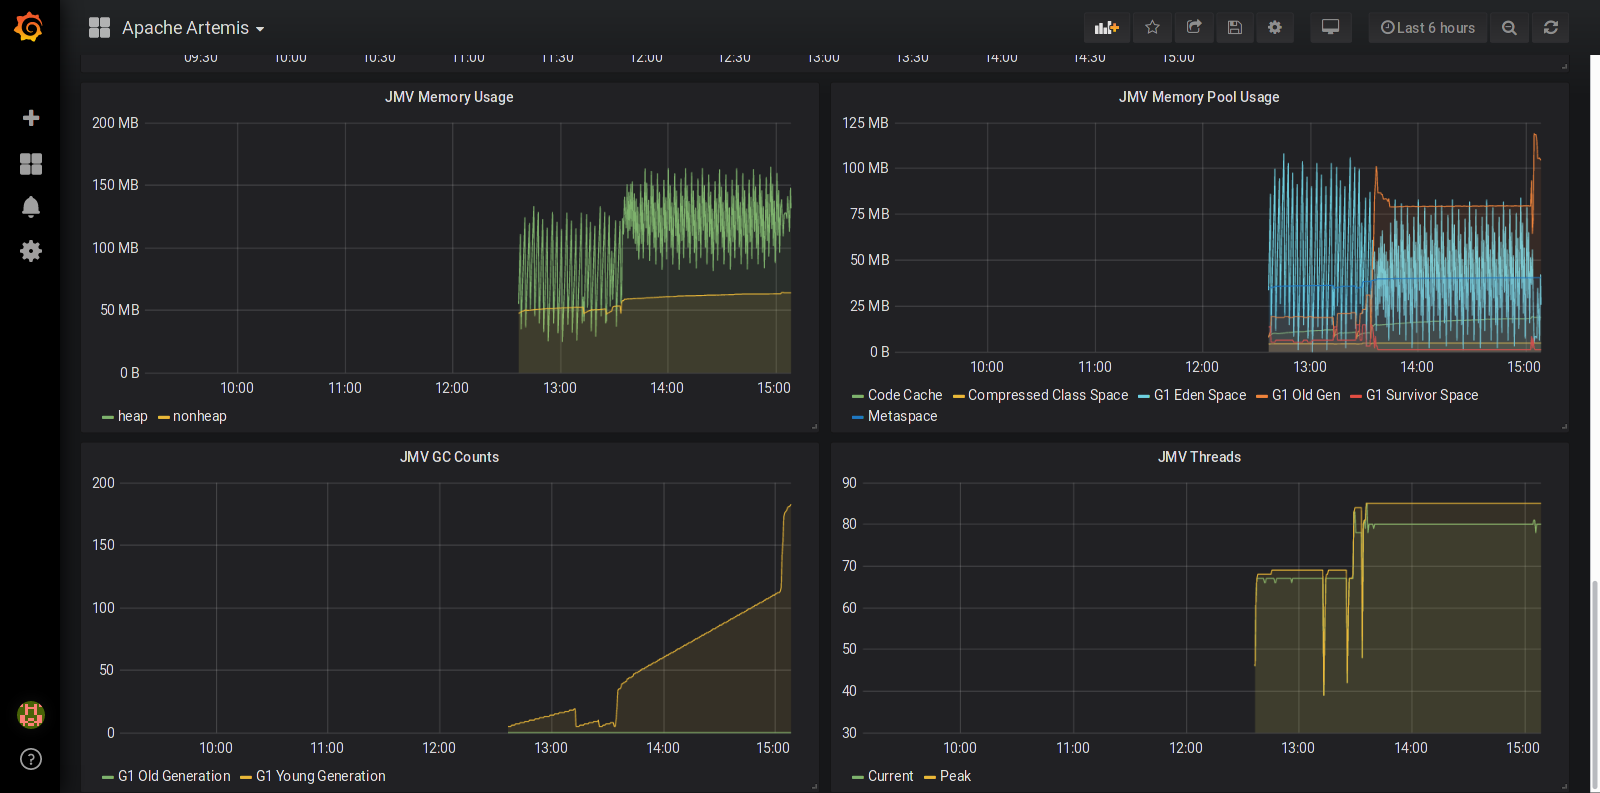
Apache Artemis
Dashboard for monitoring Apache Artemis
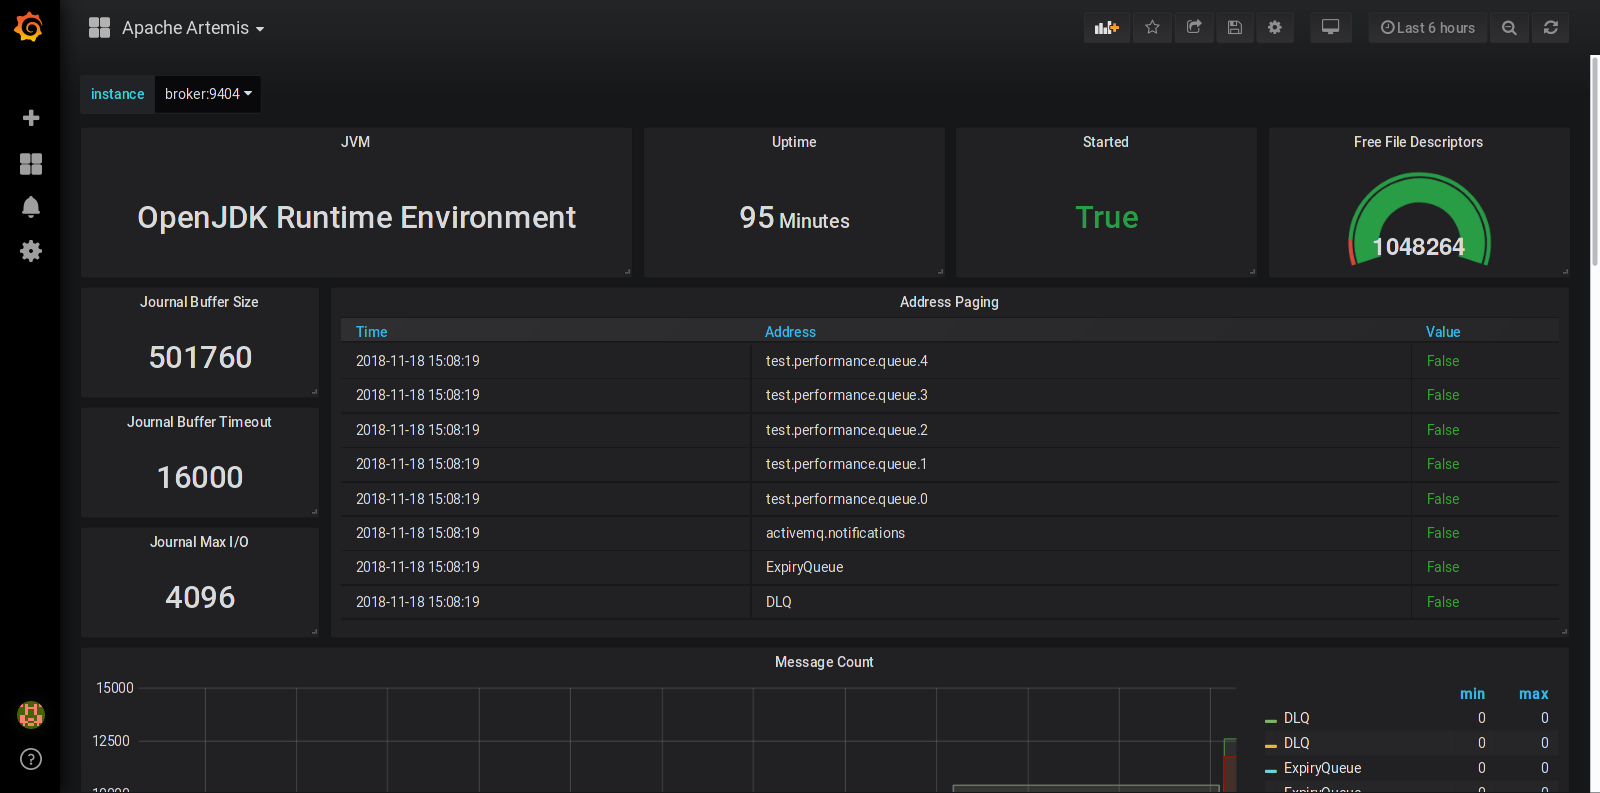
This dashboard requires the Artemis broker to be configured with the Prometheus JMX Exporter. Once the dashboard is imported, you have to set the instance variable on the dashboard to point to the exporter instance. A sample demonstration project using this dashboard is also available for download.
If you have questions, feel free to send me a message on Twitter.
Data source config
Collector type:
Collector plugins:
Collector config:
Revisions
Upload an updated version of an exported dashboard.json file from Grafana
| Revision | Description | Created | |
|---|---|---|---|
| Download |