Flink Metrics
Flink Metrics (with Kafka) on K8S This dashboard if for monitoring Flink Applications Performance. It includes metrics like record count, latency. It also has kafka parameters like bytes count. Moreover, it has k8s memory, CPU and Network statistics.
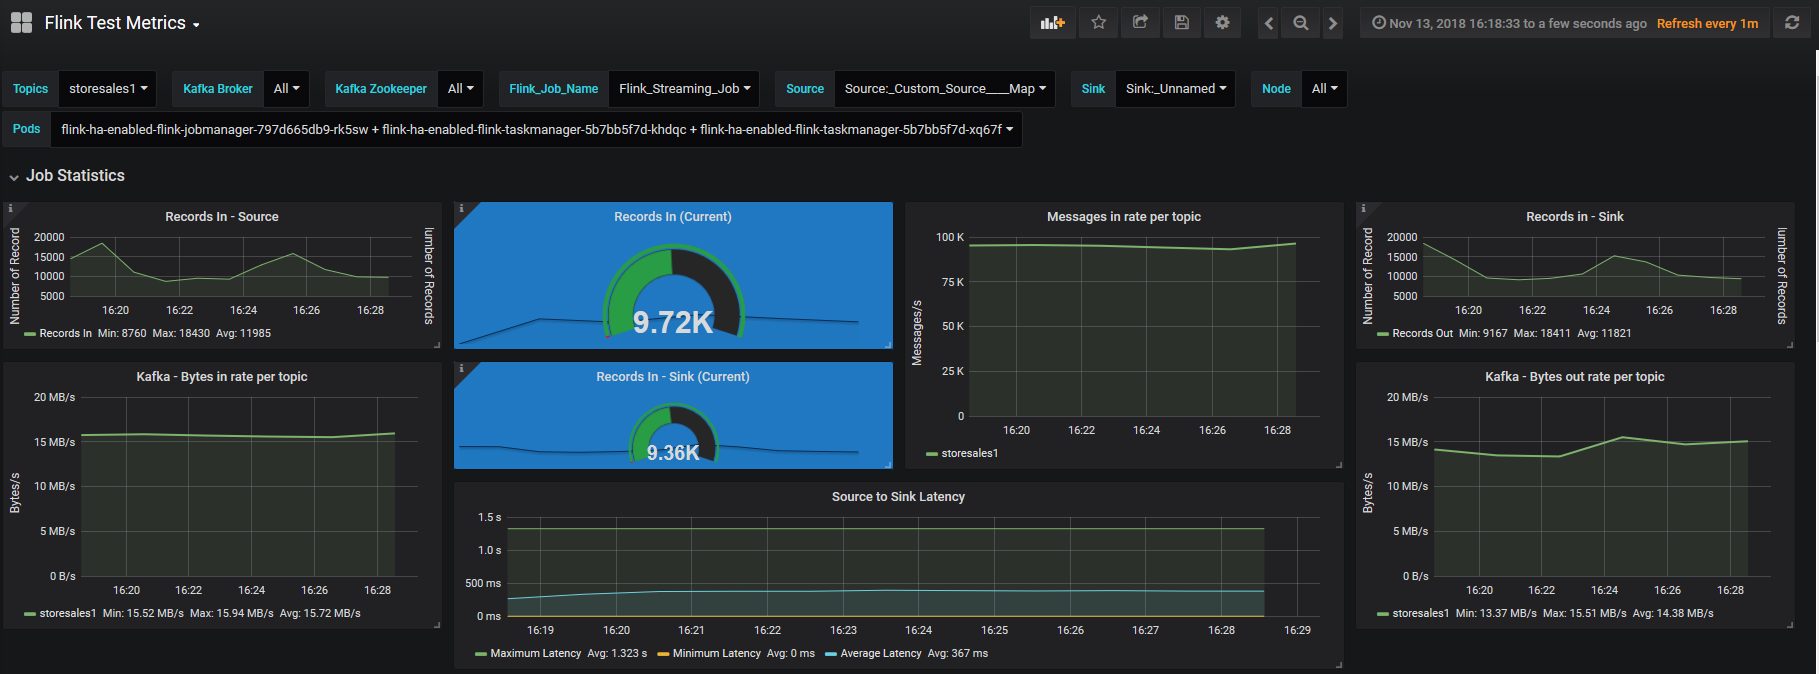
The Flink Metrics dashboard uses the prometheus data source to create a Grafana dashboard with the graph and singlestat panels.
Data source config
Collector type:
Collector plugins:
Collector config:
Revisions
Upload an updated version of an exported dashboard.json file from Grafana
| Revision | Description | Created | |
|---|---|---|---|
| Download |