Kamon System JVM metrics
Node jvm metrics
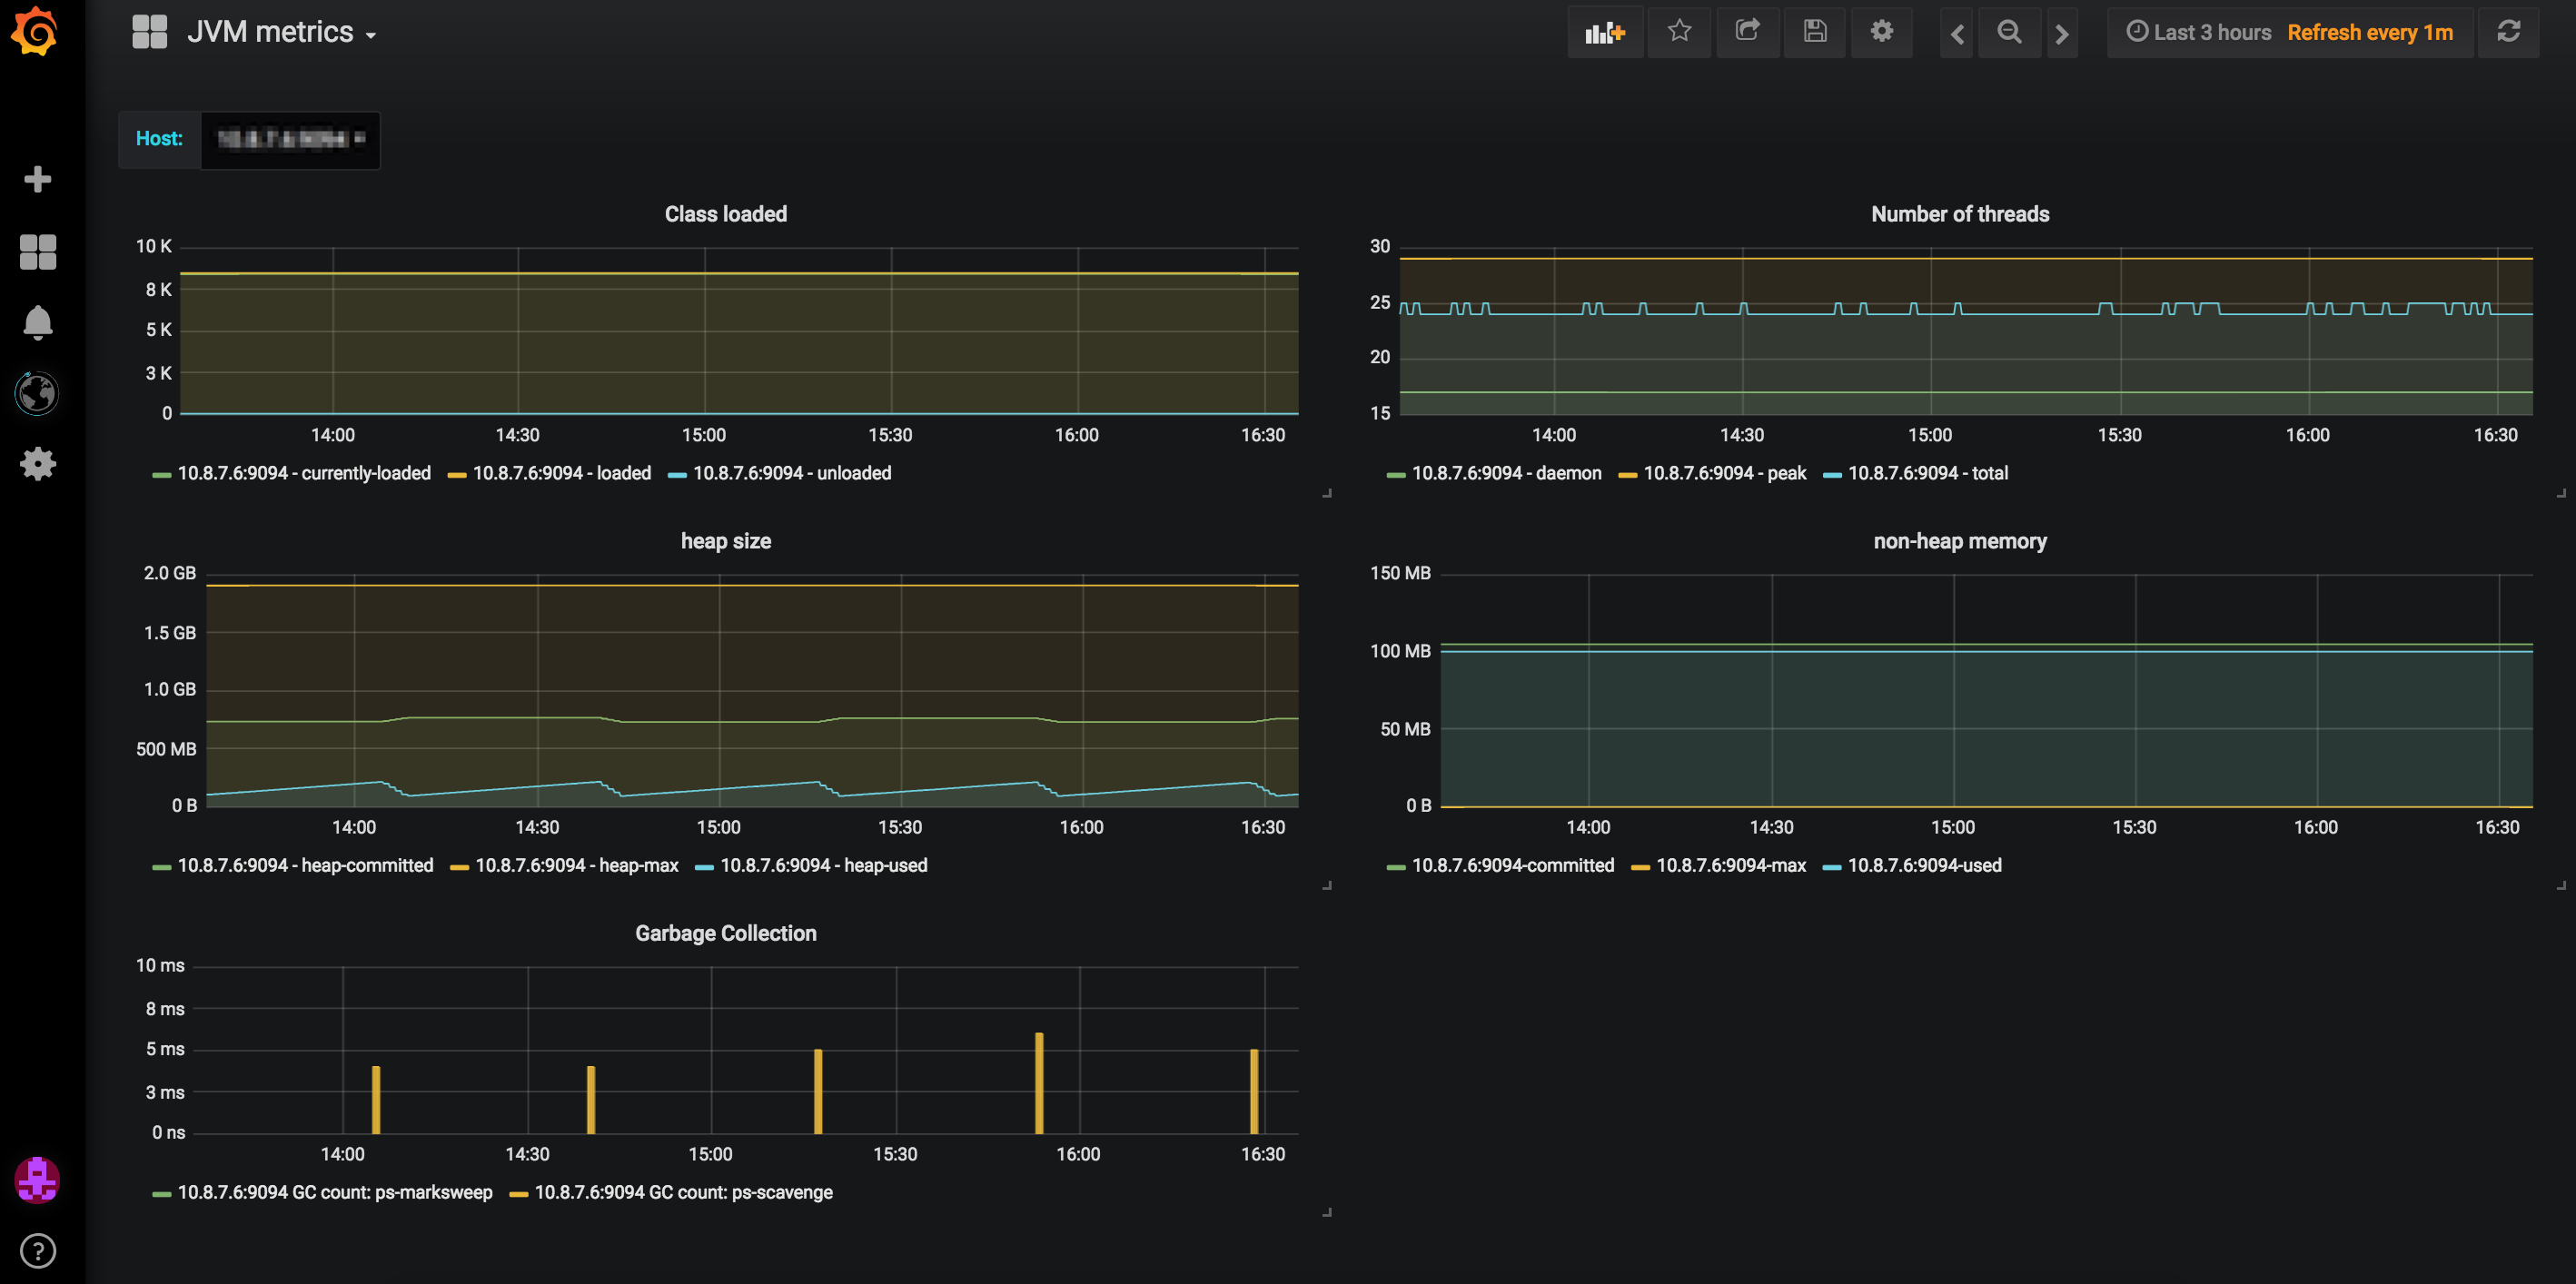
Dashboard of JVM typical metrics when using Kamon (1.x.x) System Metrics version used 1.0.0.
Displays typical JVM metrics:
Number of loaded classes Number of threads Heap usage Non-heap memory GC activity Source can be found in https://github.com/jaksky/kamon-grafana-dashboards
Data source config
Collector type:
Collector plugins:
Collector config:
Revisions
Upload an updated version of an exported dashboard.json file from Grafana
| Revision | Description | Created | |
|---|---|---|---|
| Download |
Java Virtual Machine (JVM)
Easily monitor a Java virtual machine, which allows computers to run Java programs, with Grafana Cloud's out-of-the-box monitoring solution.
Learn more