Display RightITnow ECM KPIs and time series using Grafana
Using the Grafana tool, you can display various RightITnow ECM KPIs and historical event time series into a great looking dashboard for your customers
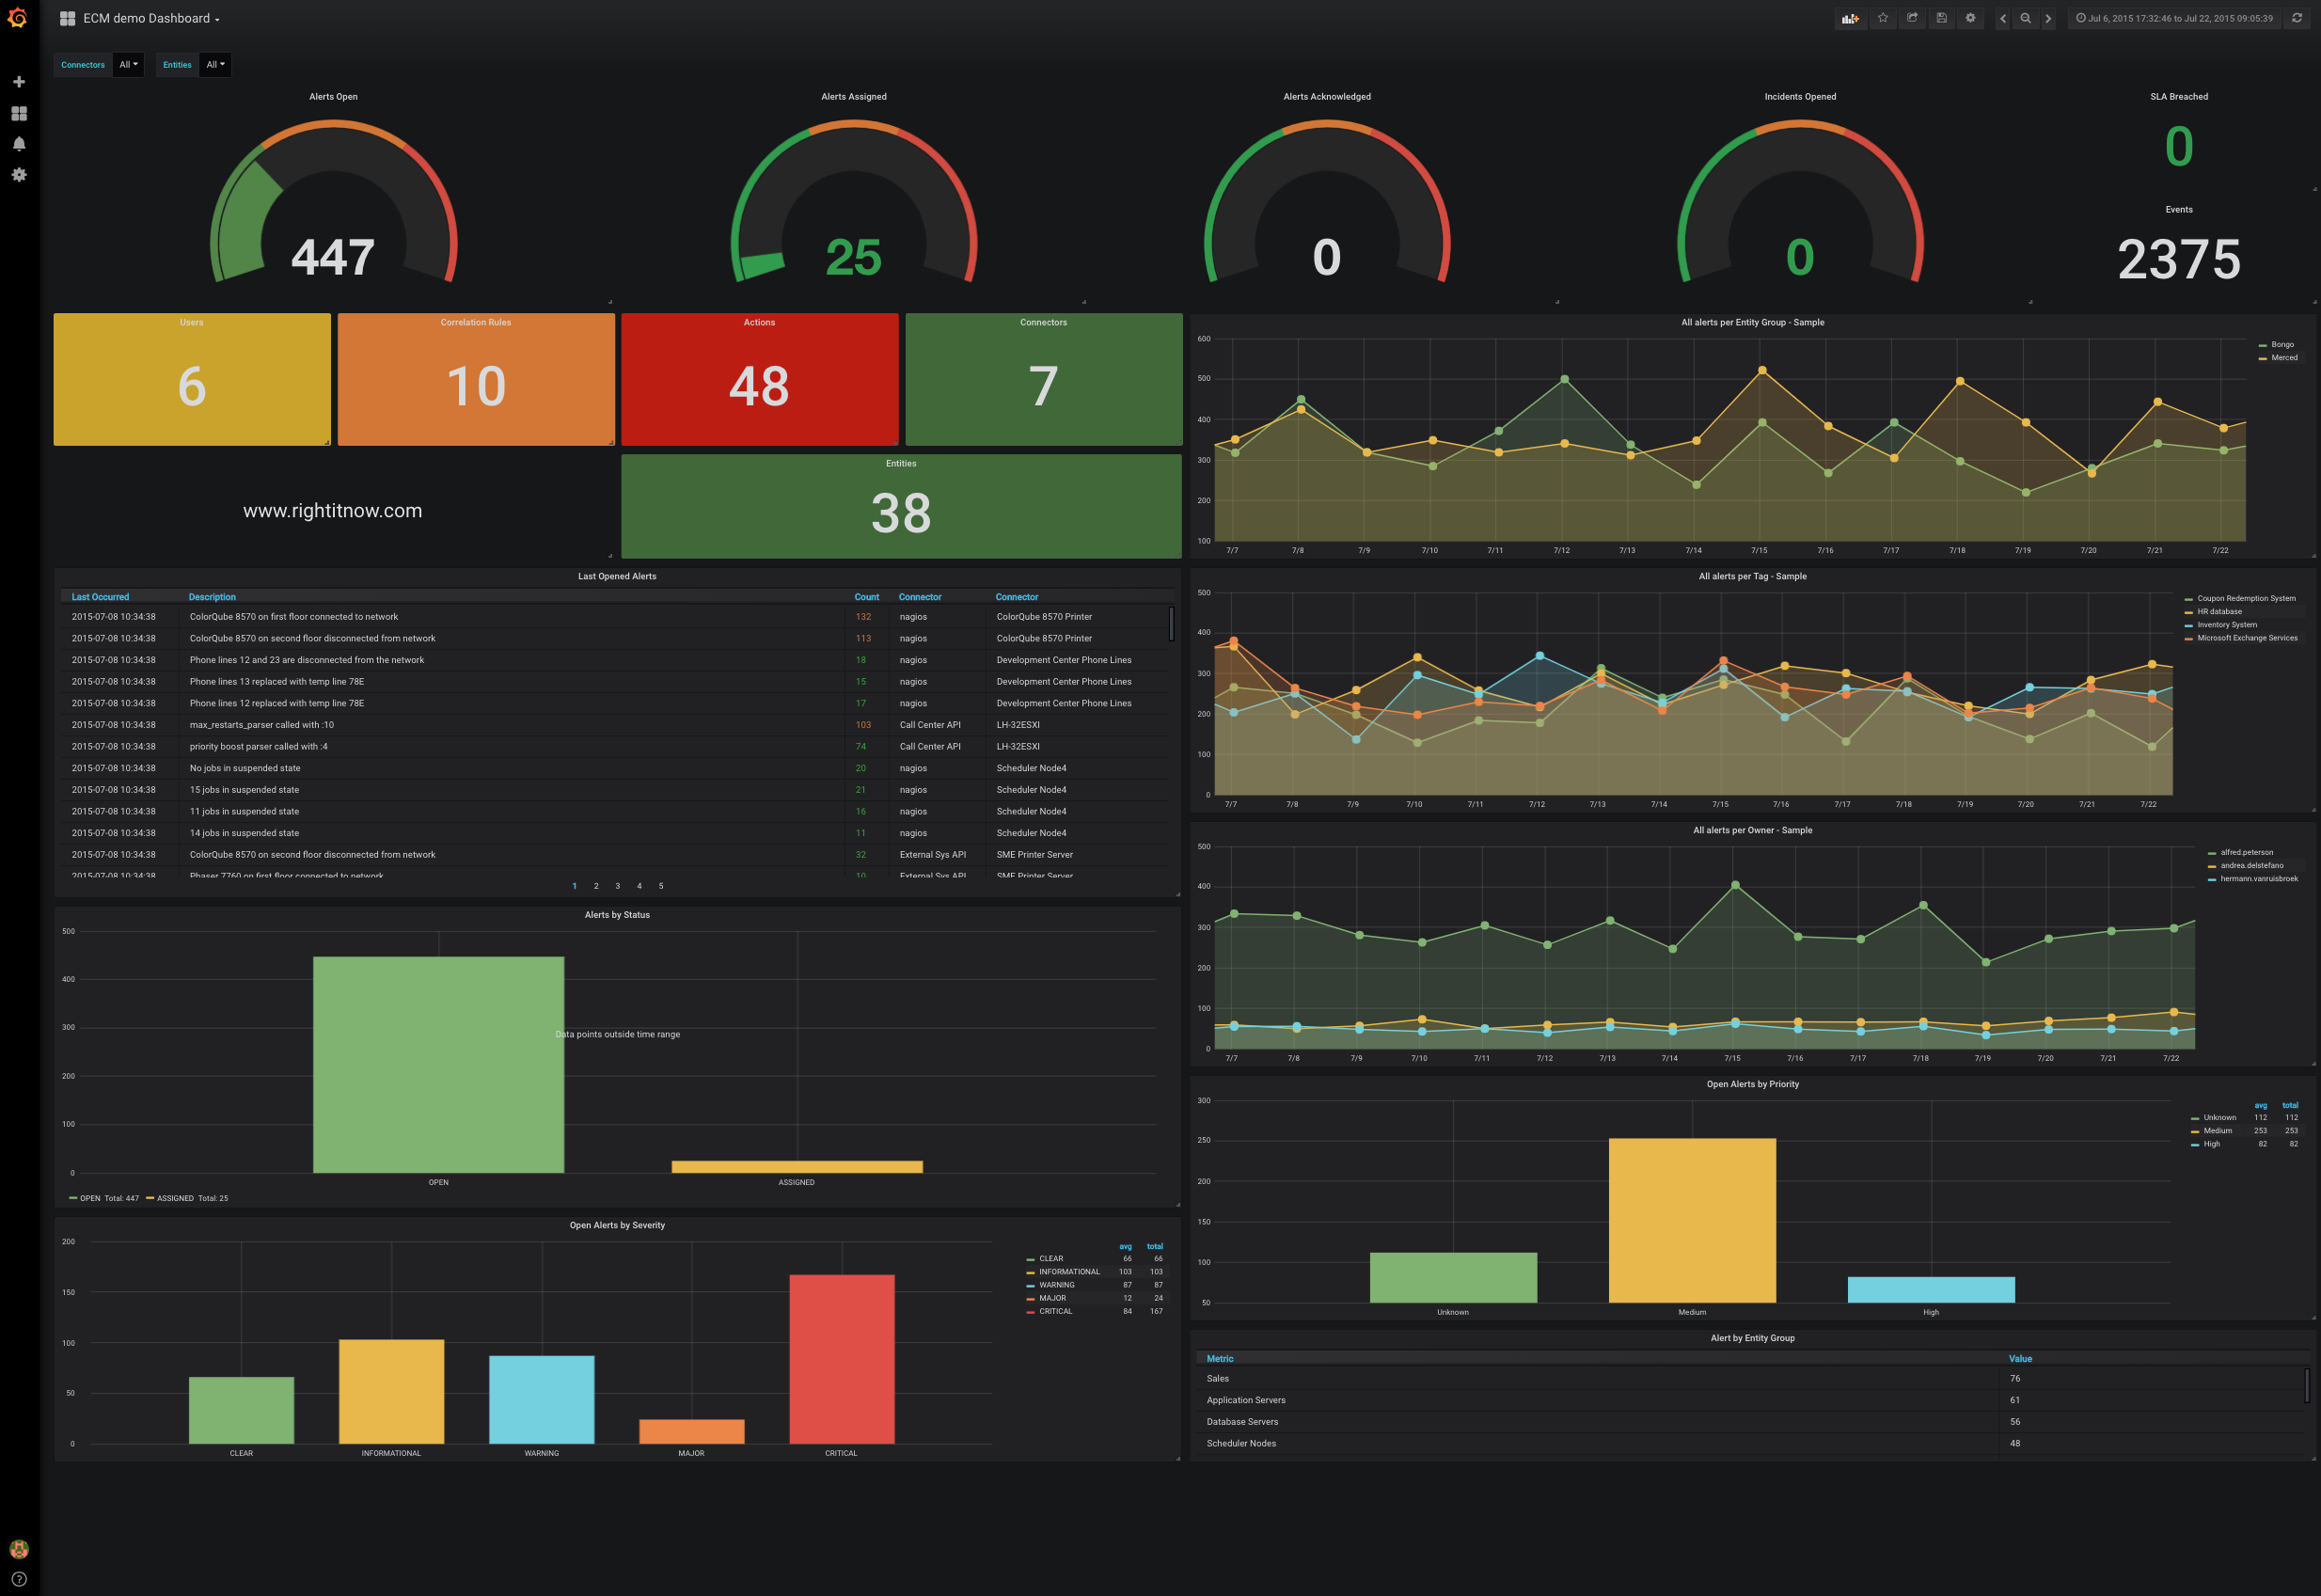
RightITnow ECM Demo Dashboard
Data source config
Collector type:
Collector plugins:
Collector config:
Revisions
Upload an updated version of an exported dashboard.json file from Grafana
| Revision | Description | Created | |
|---|---|---|---|
| Download |