1. Kubernetes Deployment Statefulset Daemonset metrics
Monitors Kubernetes deployments in cluster using Prometheus. Shows overall cluster CPU / Memory of deployments, replicas in each deployment. Uses Kube state metrics and cAdvisor metrics (741)
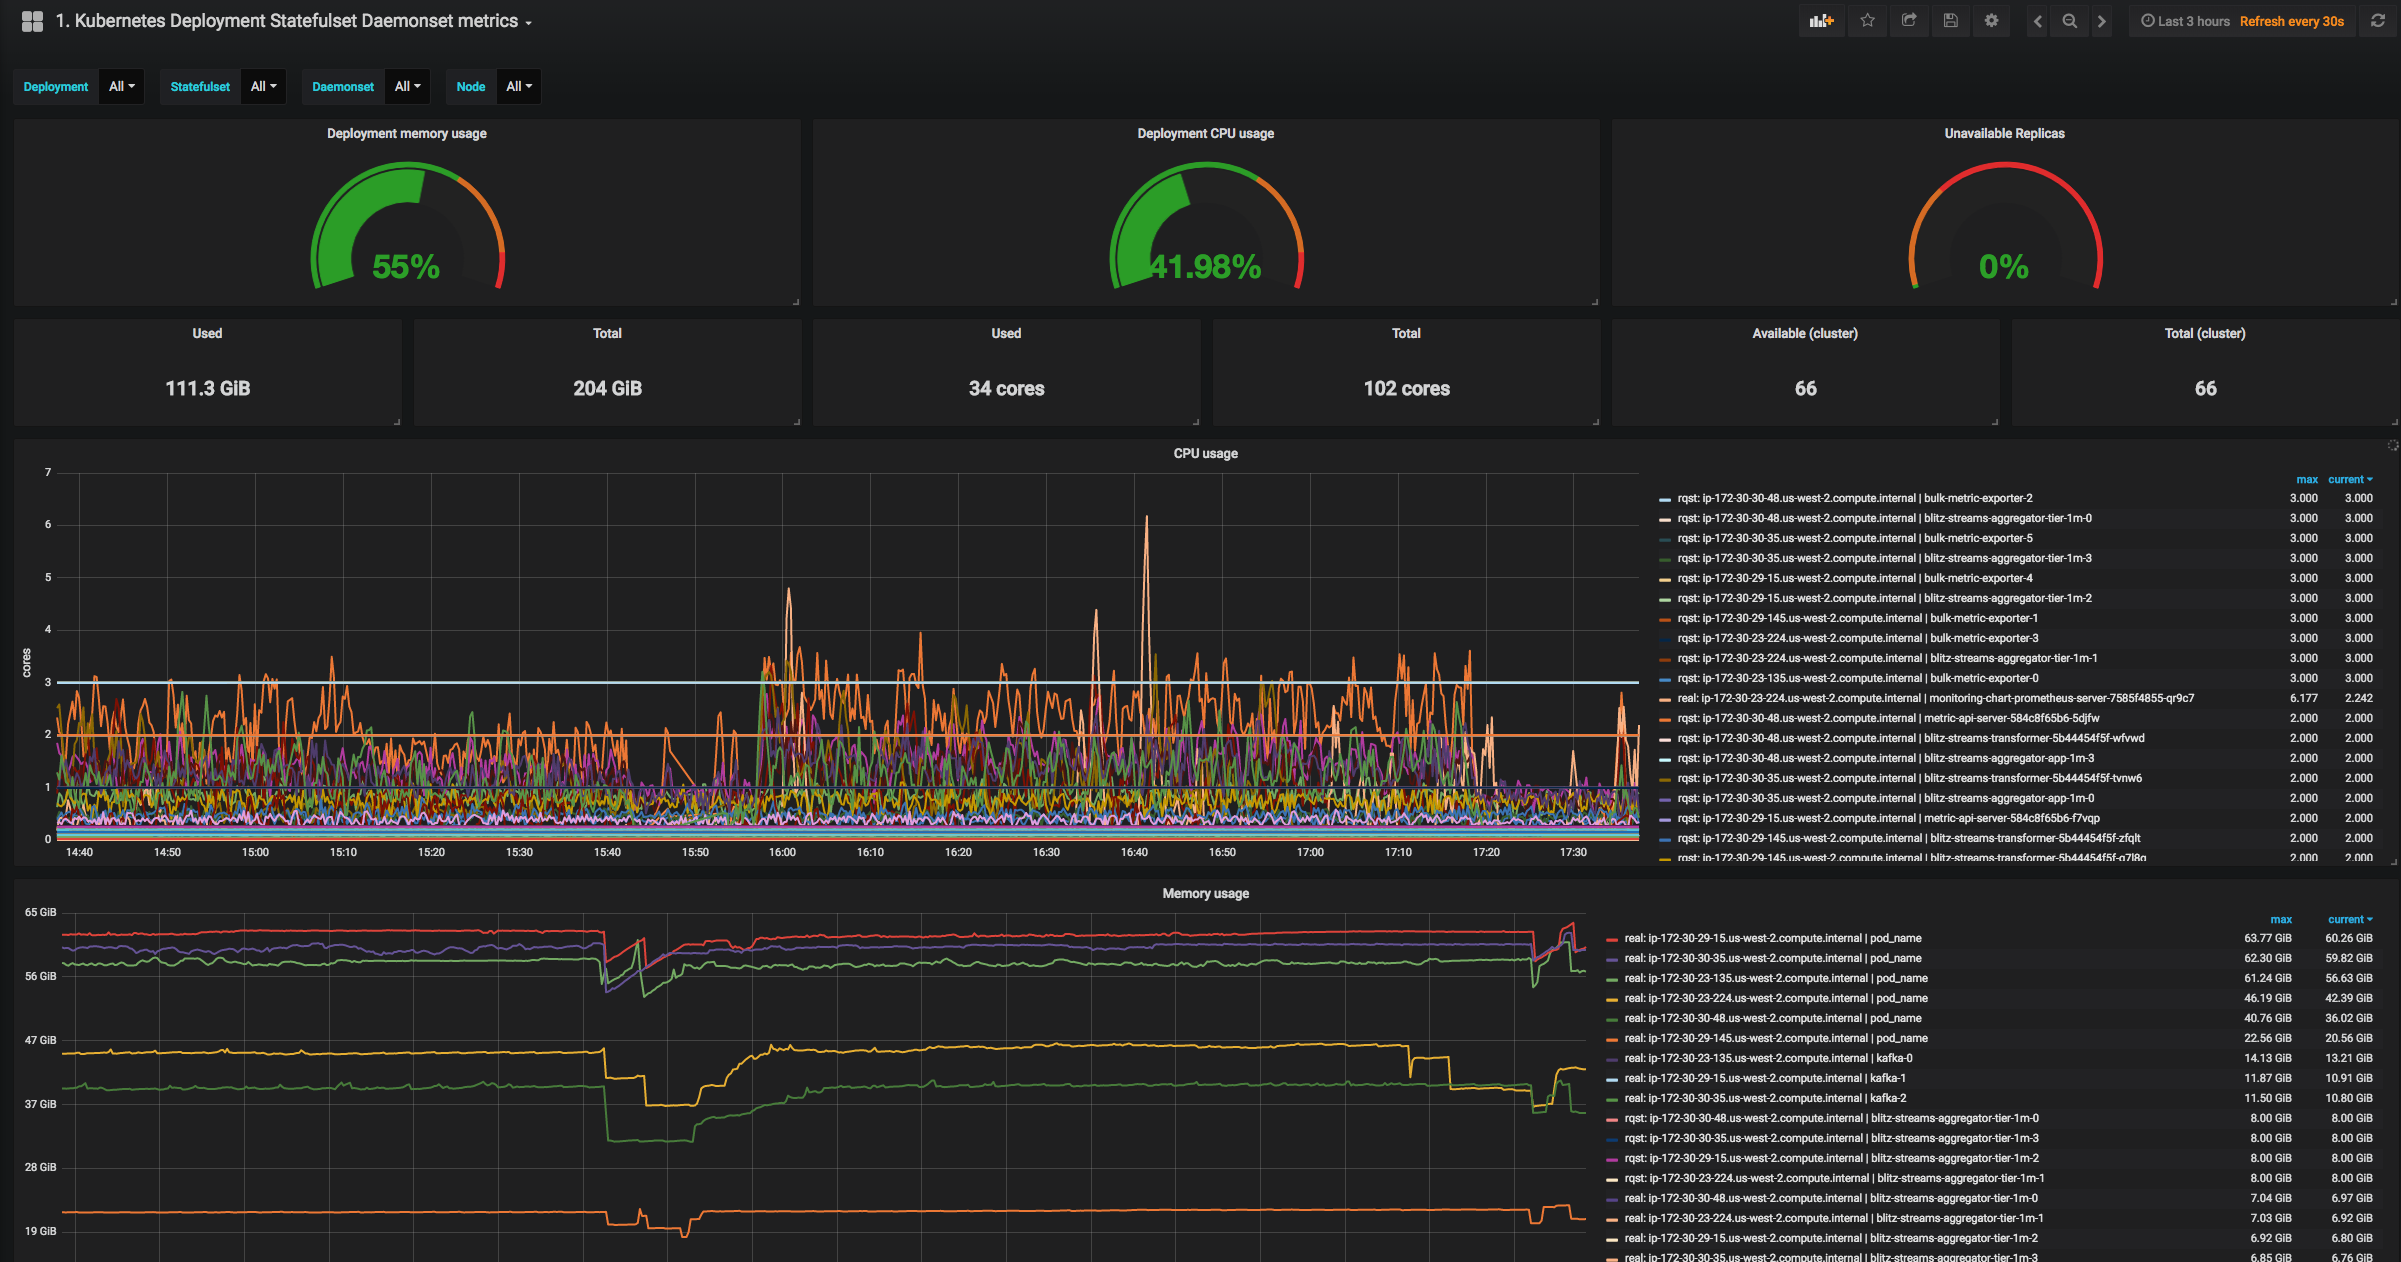
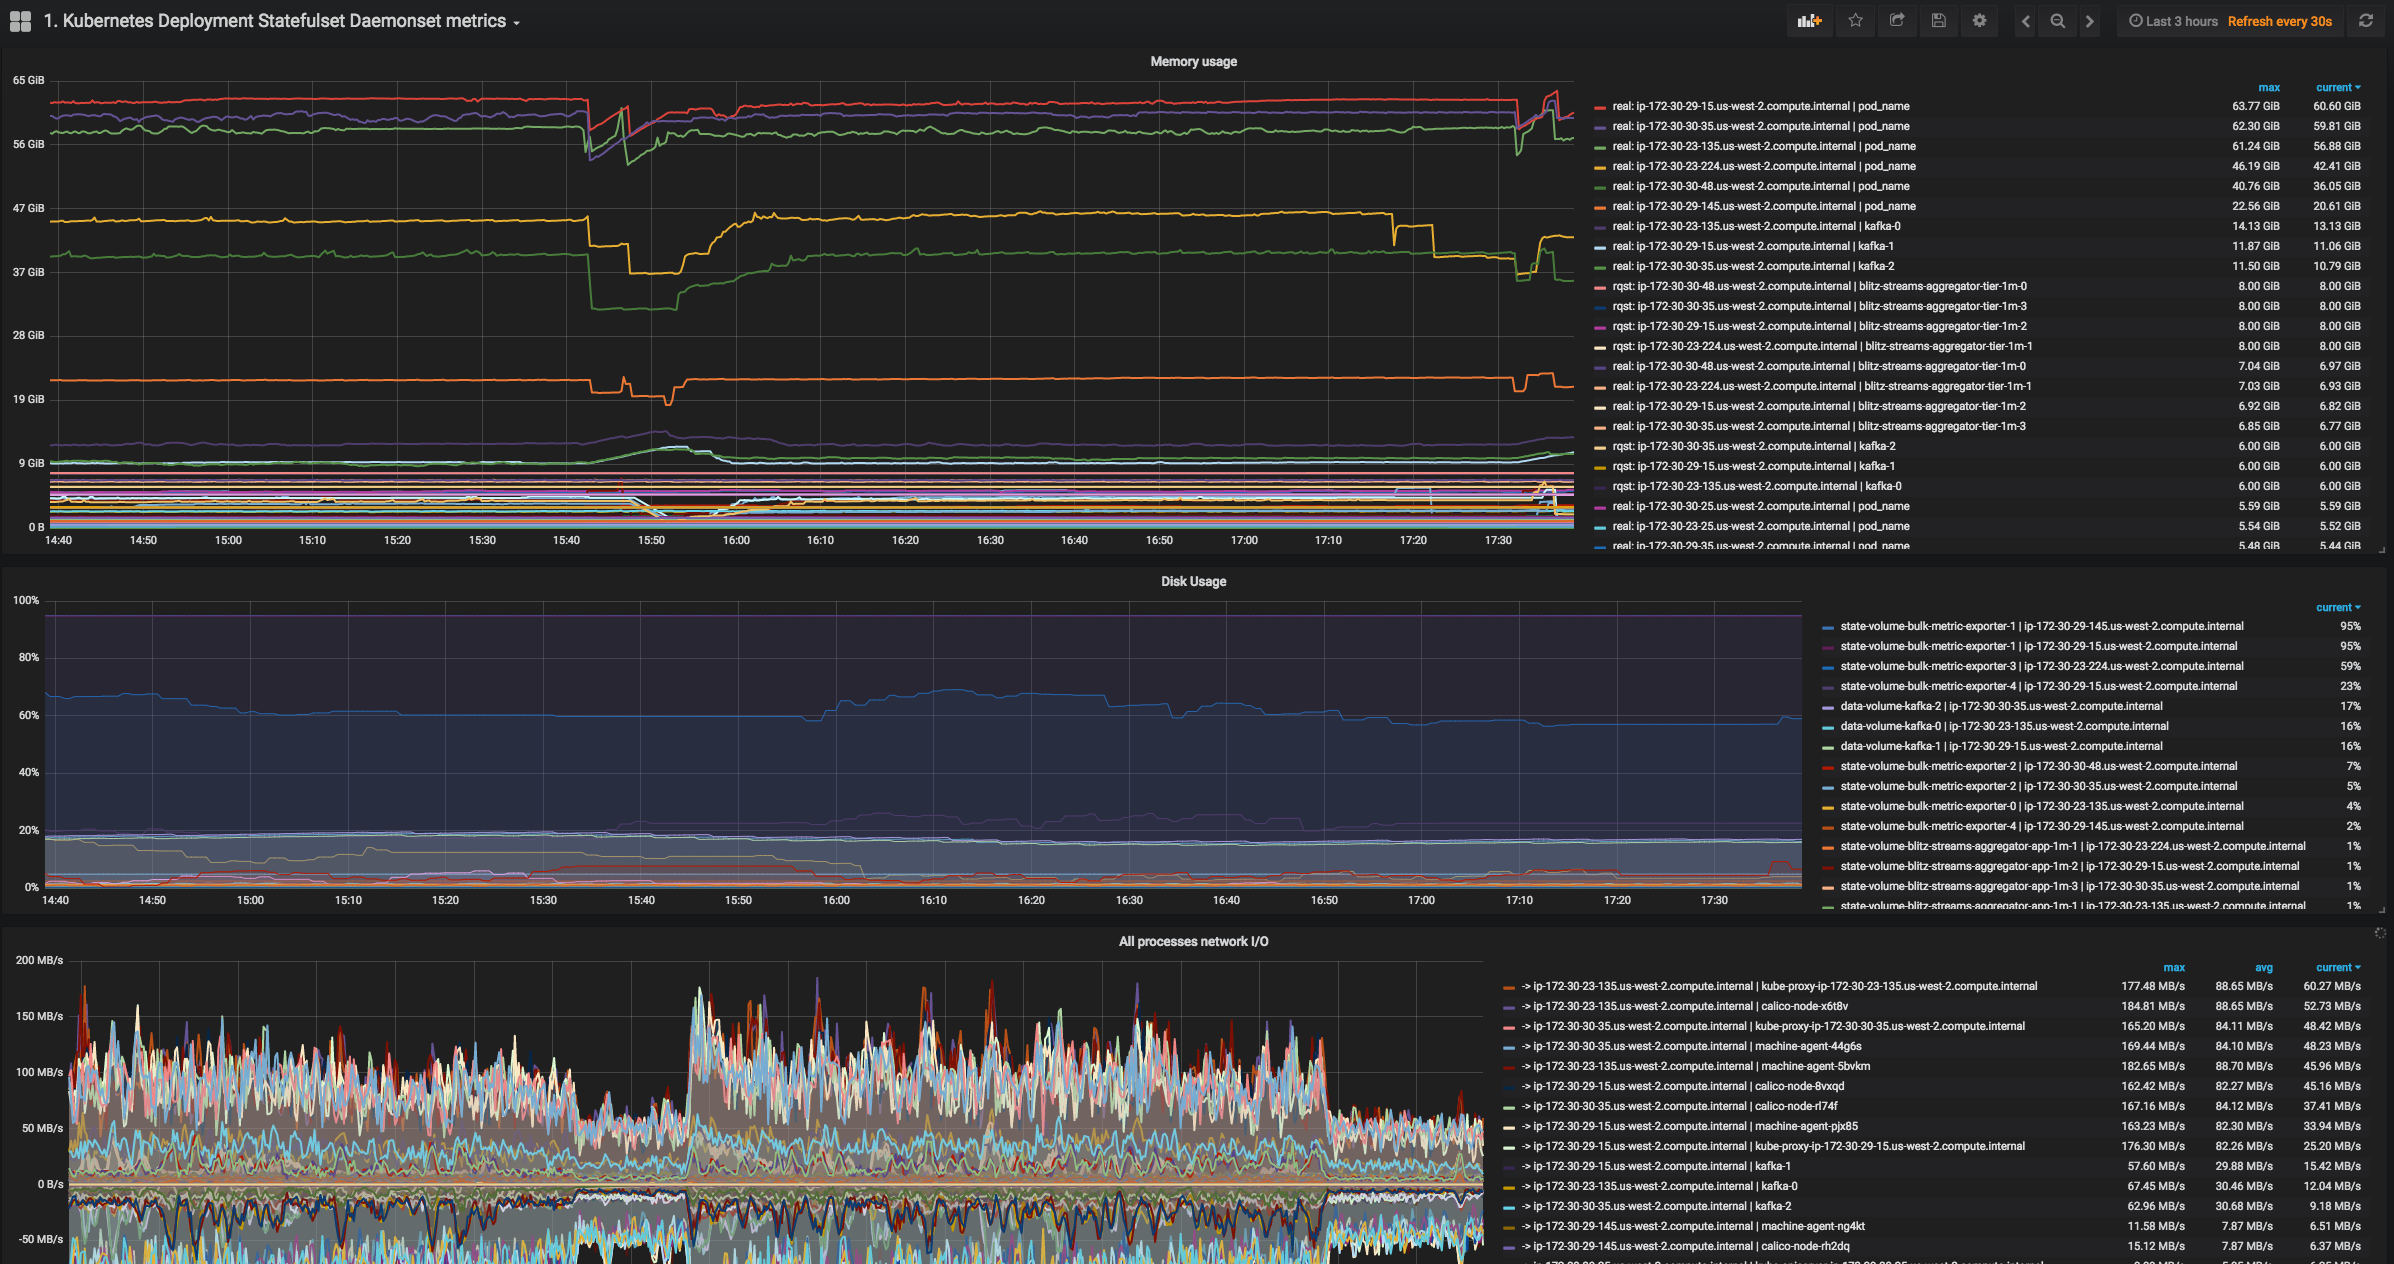
The 1. Kubernetes Deployment Statefulset Daemonset metrics dashboard uses the prometheus data source to create a Grafana dashboard with the graph and singlestat panels.
Data source config
Collector type:
Collector plugins:
Collector config:
Revisions
Upload an updated version of an exported dashboard.json file from Grafana
| Revision | Description | Created | |
|---|---|---|---|
| Download |
Kubernetes
Monitor your Kubernetes deployment with prebuilt visualizations that allow you to drill down from a high-level cluster overview to pod-specific details in minutes.
Learn more