Elasticsearch
Display Elasticsearch key metrics from Telegraf
Elasticsearch Dashboard
Display Elasticsearch monitoring graph based on Influxdb/Telegraf collector stored in Elasticsearch
(Based on Vincent VAN HOLLEBEKE Prometheus dashboard)
Node stats used
Below is list of rows in the dashboard and configuration required by the graphs in the row:
Node Variable
node_stats: os
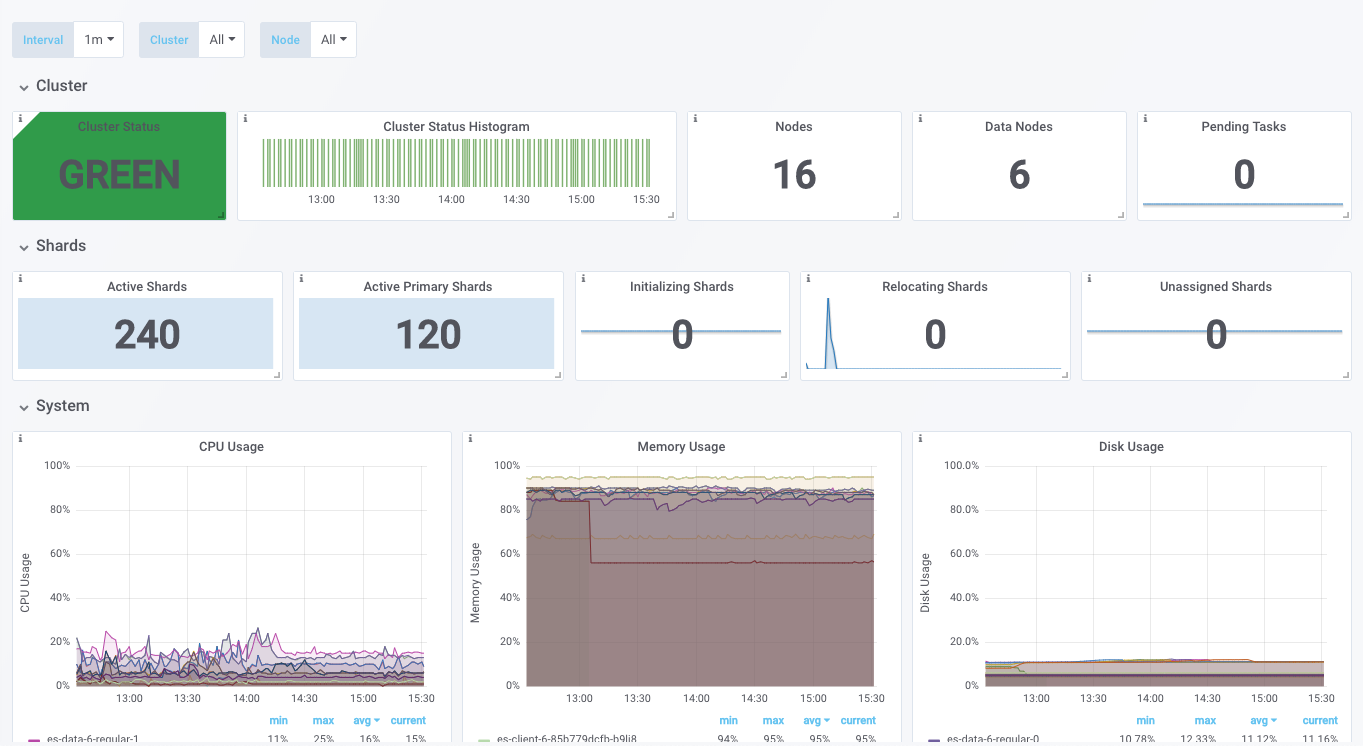
Cluster
cluster_health: indices
Shards
cluster_health: indices
System
node_stats: osnode_stats: fs
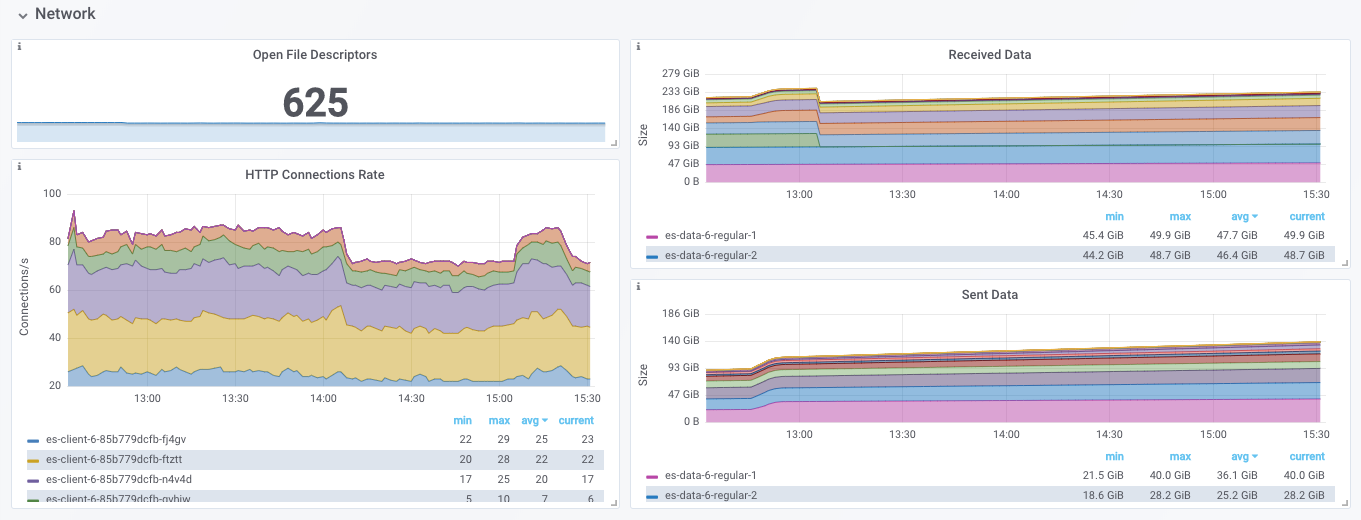
Network
node_stats: processnode_stats: httpnode_stats: transport
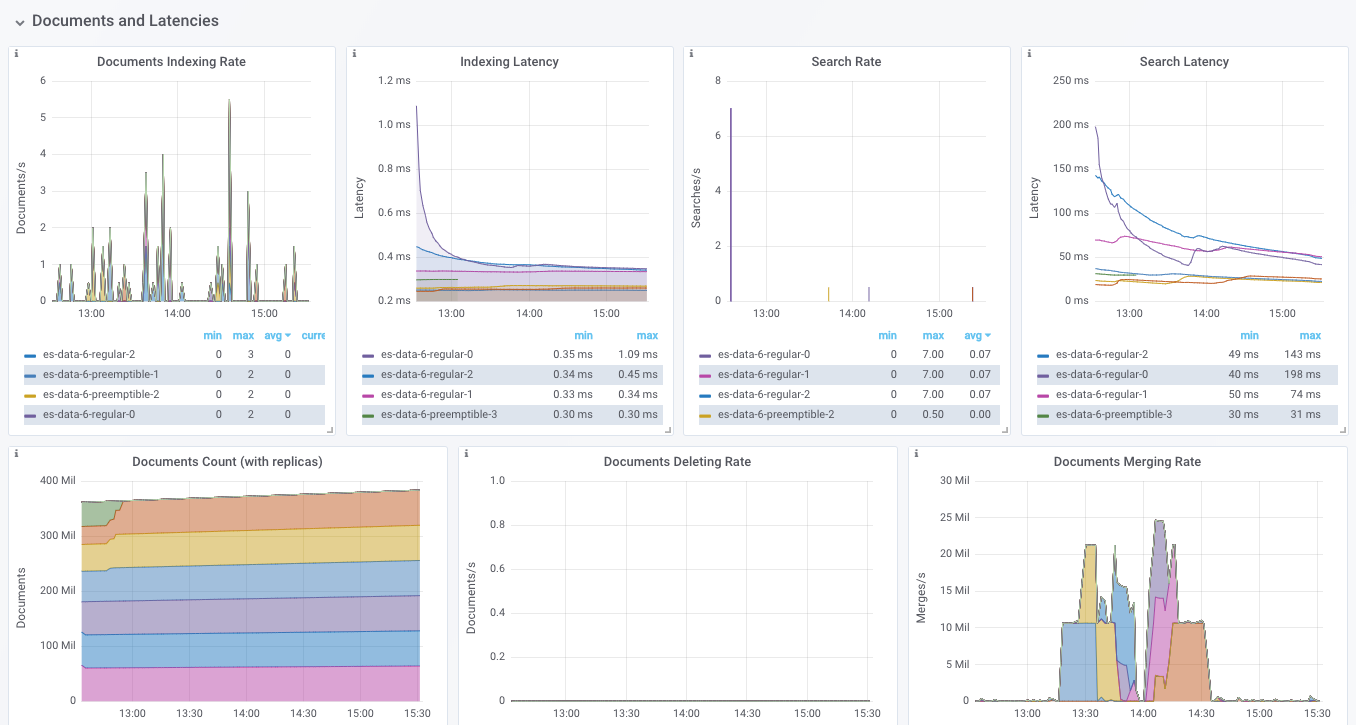
Documents and Latencies
node_stats: indices
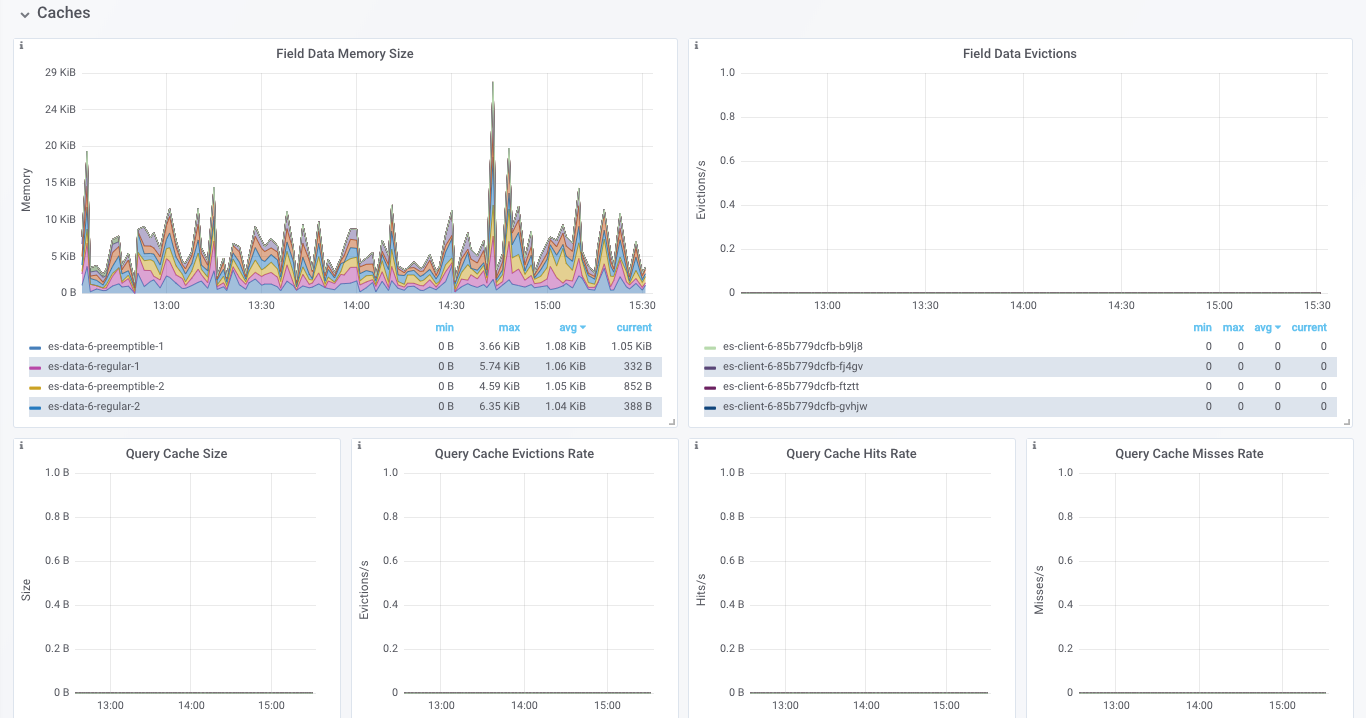
Caches
node_stats: indices
Throttling
node_stats: indices
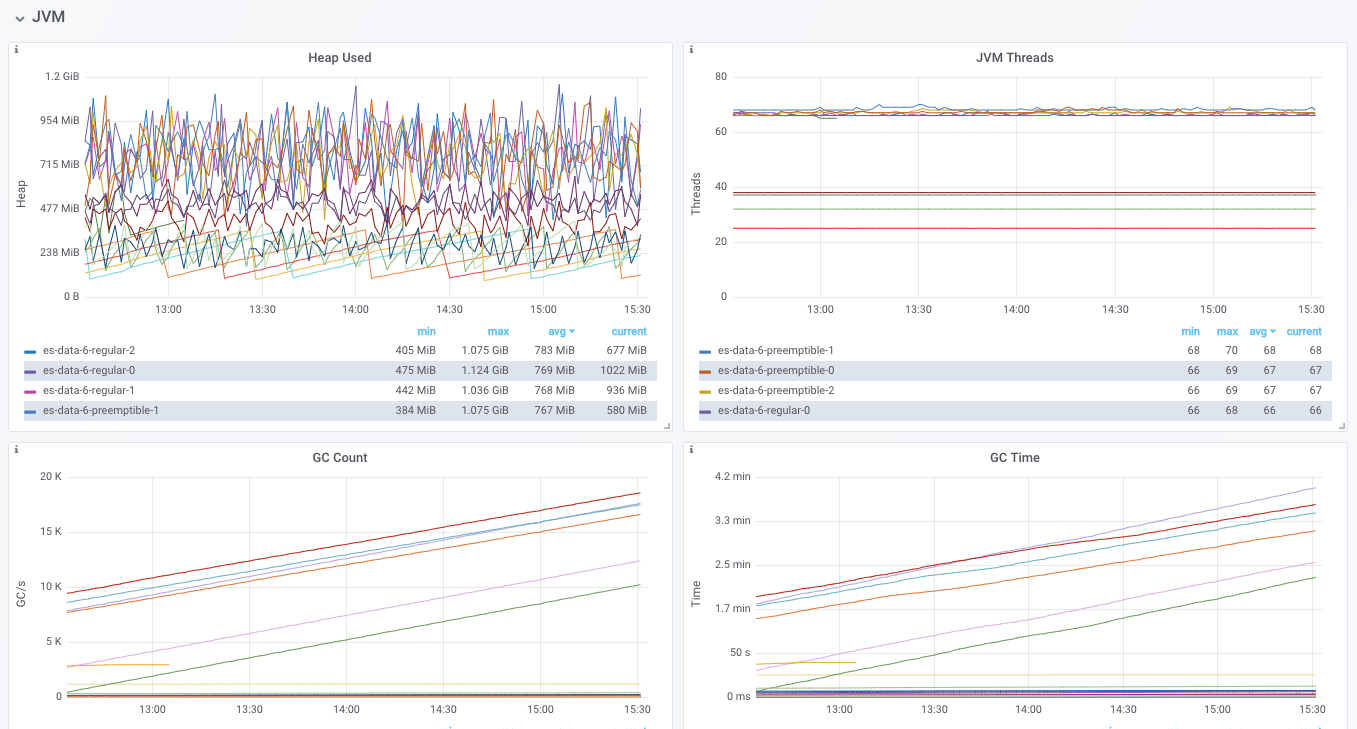
JVM
node_stats: jvm
Data source config
Collector type:
Collector plugins:
Collector config:
Revisions
Upload an updated version of an exported dashboard.json file from Grafana
| Revision | Description | Created | |
|---|---|---|---|
| Download |
Elasticsearch
Easily monitor Elasticsearch, a distributed, multitenant full-text search engine, with Grafana Cloud's out-of-the-box monitoring solution.
Learn more