RabbitMQ Monitoring
Rabbitmq stats and alerting using Telegraf (with Elasticsearch as datasource)
RabbitMQ Dashboard
Display RabbitMQ monitoring graph based on Influxdb/Telegraf collector stored in Elasticsearch
Node stats used
Below is list of rows in the dashboard and measurements and fields required by the graphs in the row:
Variables
rabbitmq_noderabbitmq_queuerabbitmq_exchange
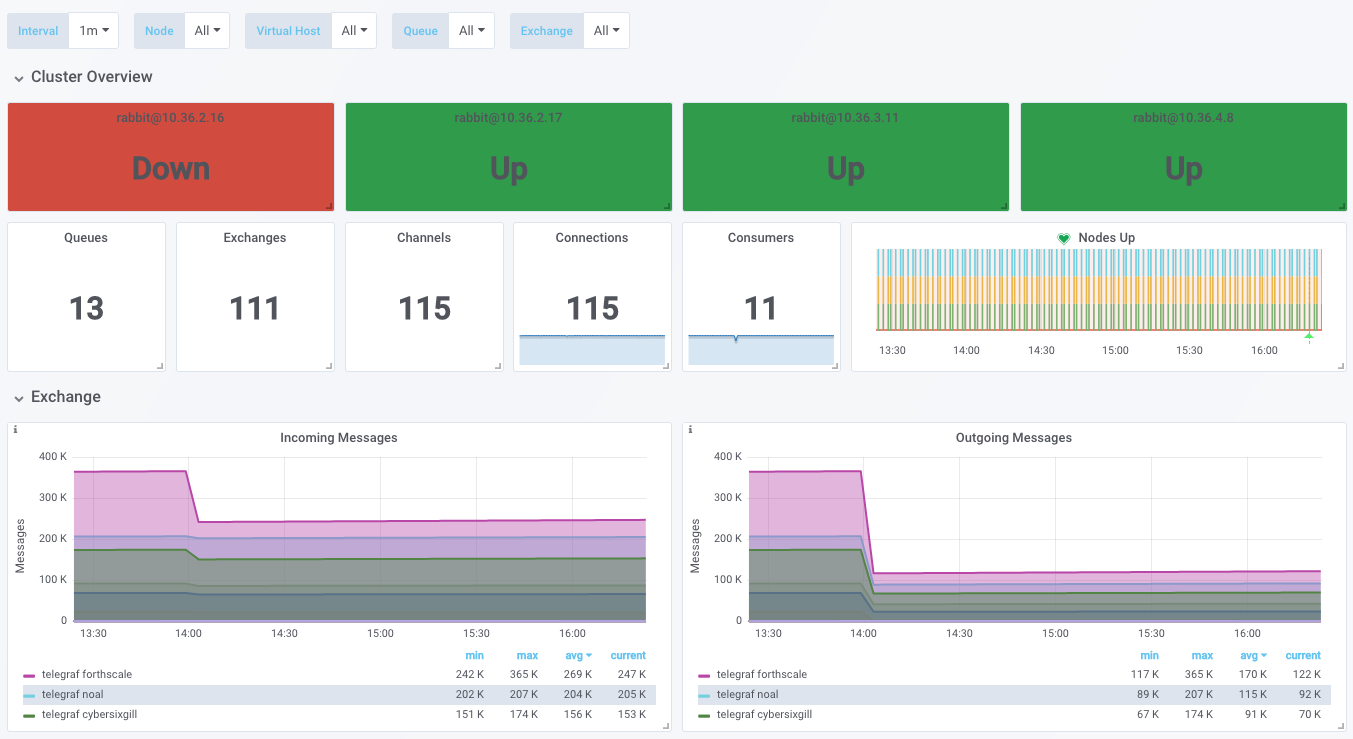
Cluster Overview
rabbitmq_noderabbitmq_overview
Exchange
rabbitmq_exchange
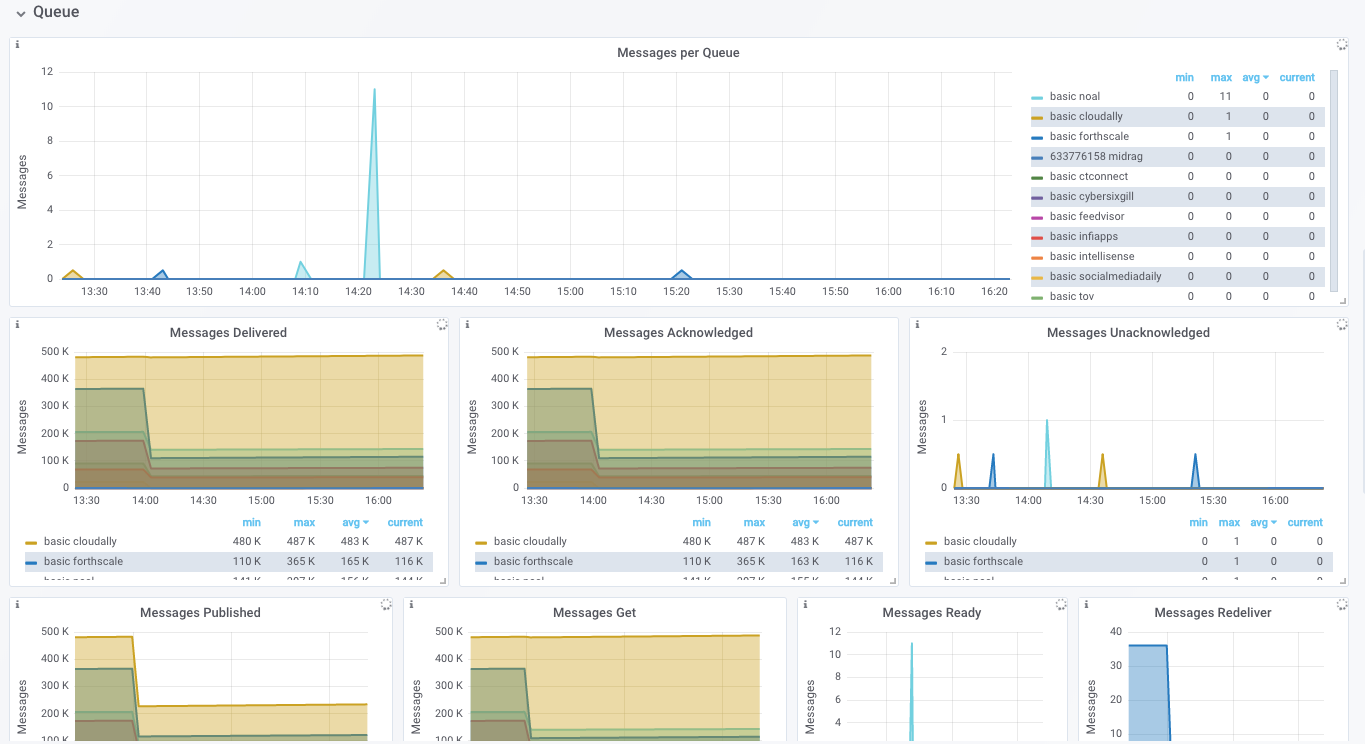
Queue
rabbitmq_queue
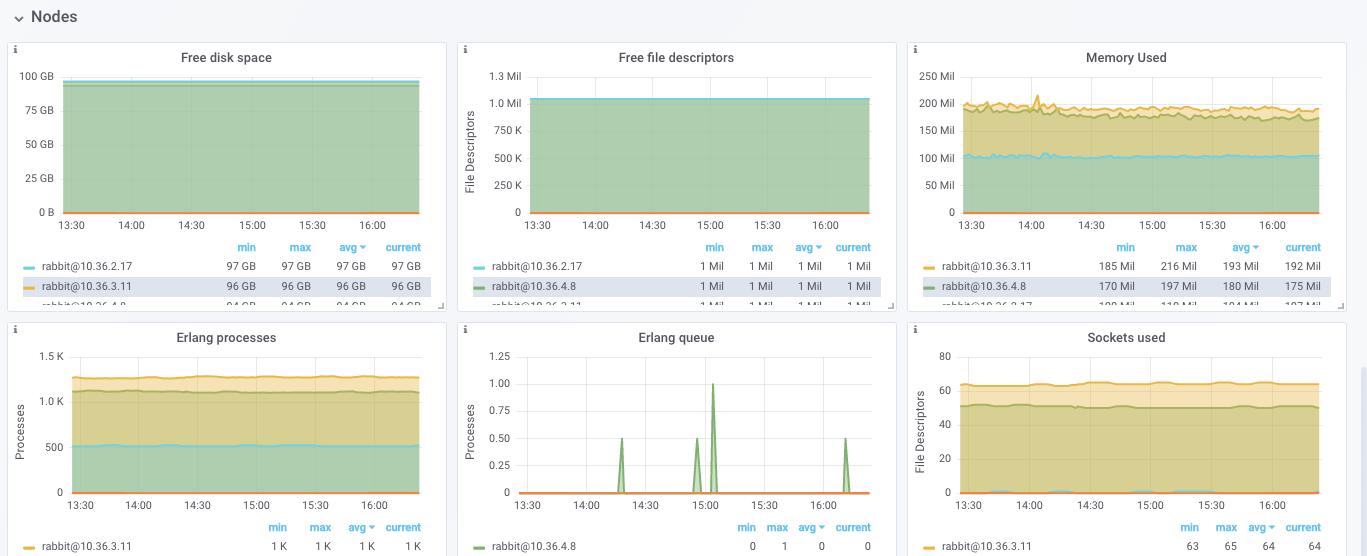
Nodes
rabbitmq_node
Data source config
Collector type:
Collector plugins:
Collector config:
Revisions
Upload an updated version of an exported dashboard.json file from Grafana
| Revision | Description | Created | |
|---|---|---|---|
| Download |
RabbitMQ
Easily monitor RabbitMQ, the most widely deployed open source message broker, with Grafana Cloud's out-of-the-box monitoring solution.
Learn more