GlusterFS
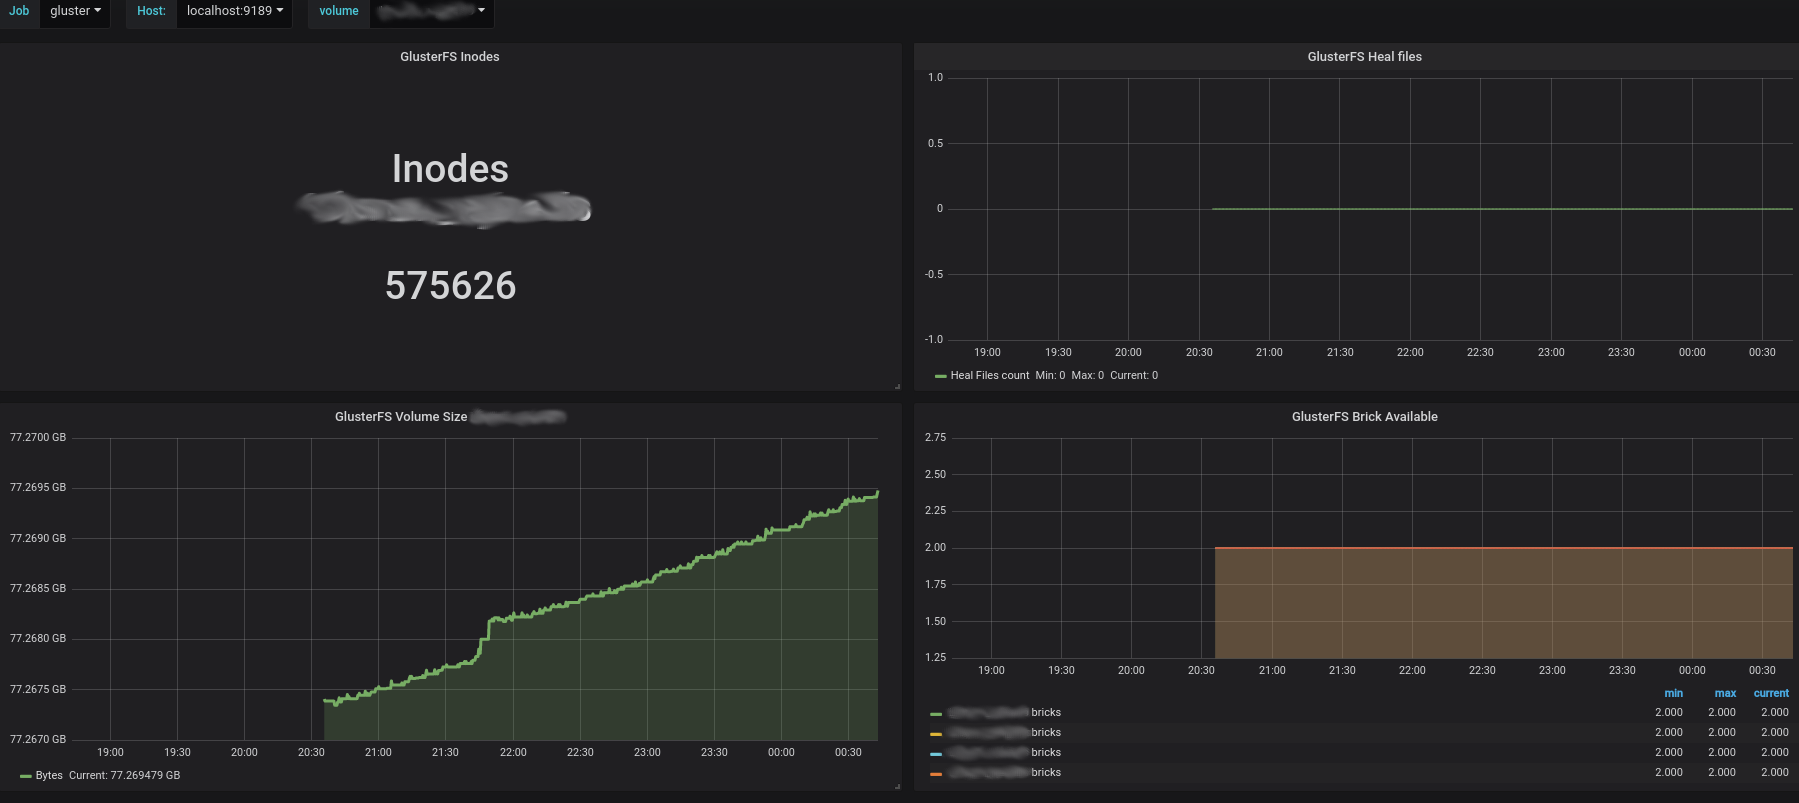
Dashboard for GlusterFS data from gluster_exporter via Prometheus.
Inodes by volume, size by volume, heal files count, available bricks.
gluster_exporter: https://github.com/ofesseler/gluster_exporter
Prometheus yml -job_name: gluster static_configs: -targets: ['localhost:9189']
Data source config
Collector type:
Collector plugins:
Collector config:
Revisions
Upload an updated version of an exported dashboard.json file from Grafana
| Revision | Description | Created | |
|---|---|---|---|
| Download |