VMware vSphere - VMs
VMware vSphere Dashboard - VMs (Grafana 11.x / InfluxDB v2.x)
Attention - Latest versions of this Dashboard have been built for InfluxDB v2.0 using Flux, you can easily see it under the revisions tab, grab the one you need for your InfluxDB v1.8 or v2.0
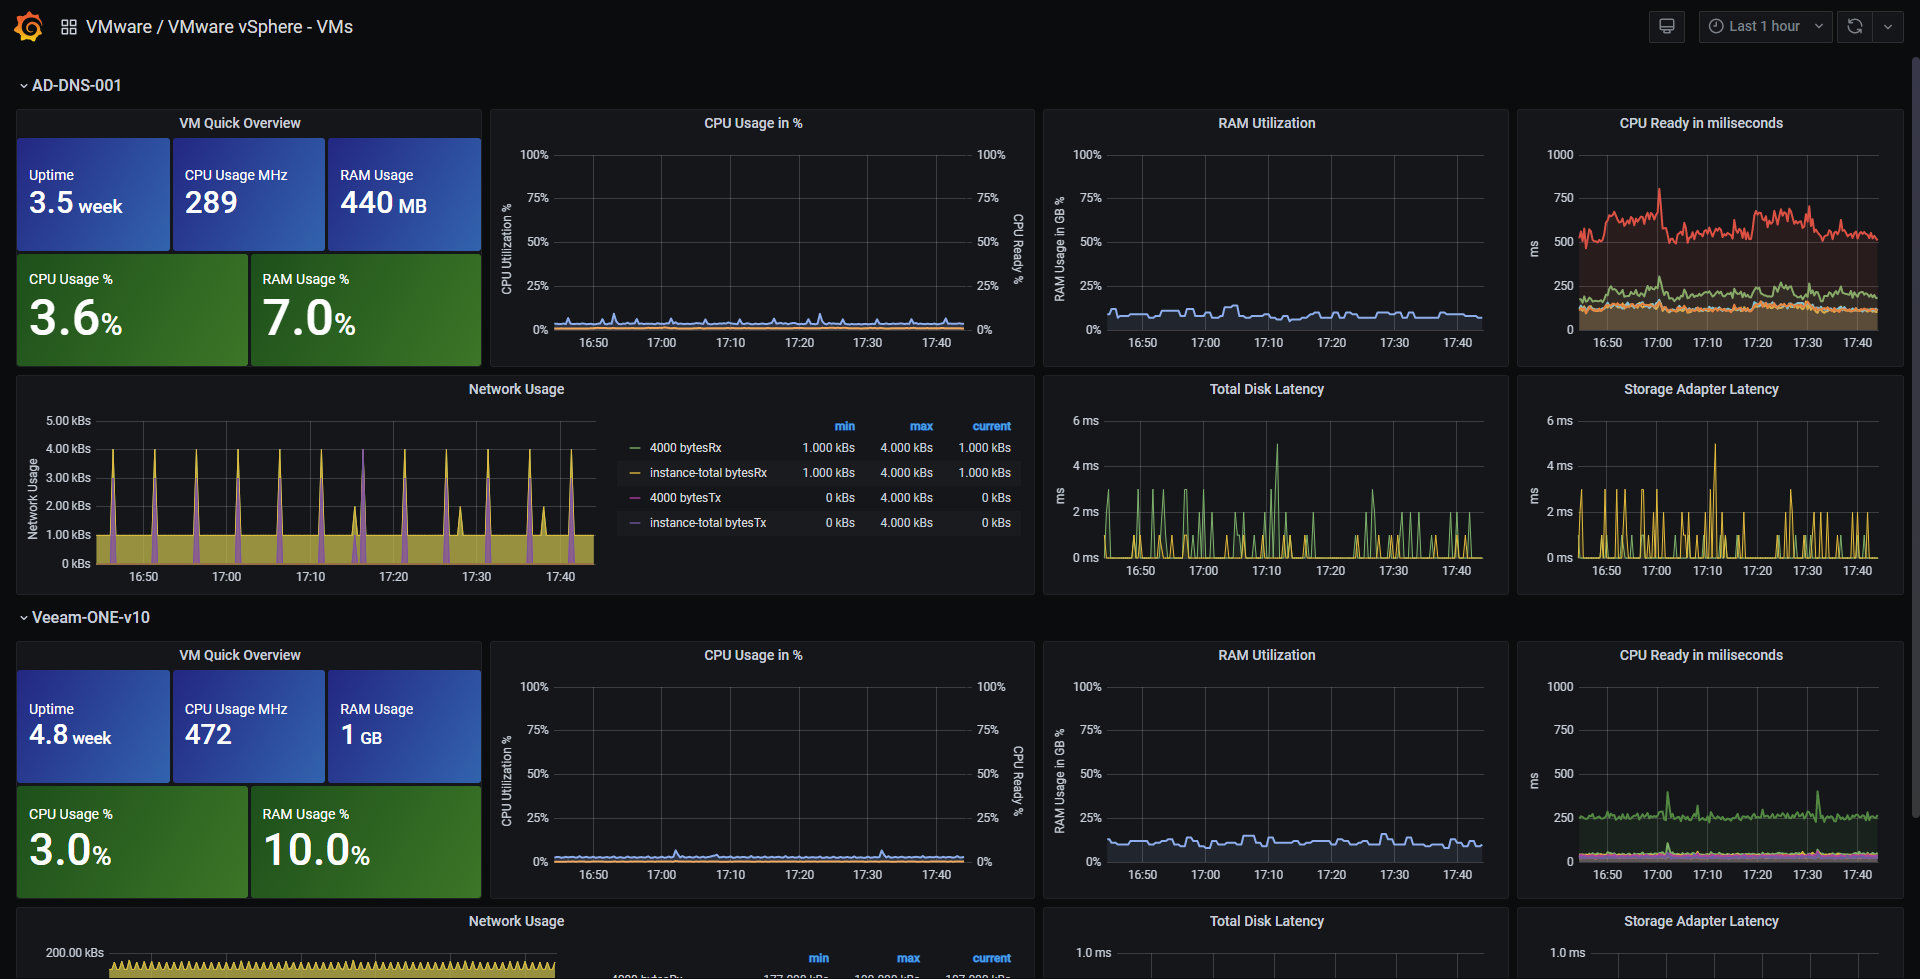
This dashboard contains two different sections, one to monitor the ESXi and vCenter Performance, and another one for Virtual Machines Performance. The Dashboard has variables to make it easier to use, and more suitable for all different workloads out there. The gauges are configured automatically as well to the Datastores you select, in case you have so many, consider changing the Min Width on the Repeat Panel.
You should download as well the next Dashboards to have the full Hosts and Datastores visibility:
- Grafana vSphere Overview Dashboard
- Grafana vSphere Hosts Dashboard
- Grafana vSphere Datastores Dashboard
Using the latest version of Telegraf should work, more information here
More information is available at: https://jorgedelacruz.es
Measurements & Fields
- Cluster Stats
- Cluster services: CPU, memory, failover
- CPU: total, usage
- Memory: consumed, total, vmmemctl
- VM operations: # changes, clone, create, deploy, destroy, power, reboot, reconfigure, register, reset, shutdown, standby, vmotion
- Host Stats:
- CPU: total, usage, cost, mhz
- Datastore: iops, latency, read/write bytes, # reads/writes
- Disk: commands, latency, kernel reads/writes, # reads/writes, queues
- Memory: total, usage, active, latency, swap, shared, vmmemctl
- Network: broadcast, bytes, dropped, errors, multicast, packets, usage
- Power: energy, usage, capacity
- Res CPU: active, max, running
- Storage Adapter: commands, latency, # reads/writes
- Storage Path: commands, latency, # reads/writes
- System Resources: cpu active, cpu max, cpu running, cpu usage, mem allocated, mem consumed, mem shared, swap
- System: uptime
- Flash Module: active VMDKs
- VM Stats:
- CPU: demand, usage, readiness, cost, mhz
- Datastore: latency, # reads/writes
- Disk: commands, latency, # reads/writes, provisioned, usage
- Memory: granted, usage, active, swap, vmmemctl
- Network: broadcast, bytes, dropped, multicast, packets, usage
- Power: energy, usage
- Res CPU: active, max, running
- System: operating system uptime, uptime
- Virtual Disk: seeks, # reads/writes, latency, load
- Datastore stats:
- Disk: Capacity, provisioned, used
Data source config
Collector config:
Upload an updated version of an exported dashboard.json file from Grafana
| Revision | Description | Created | |
|---|---|---|---|
| Download |
VMware vSphere
Easily monitor VMware vSphere, a virtualization platform that helps consolidate IT infrastructure, with Grafana Cloud's out-of-the-box monitoring solution.
Learn more