Telegraf: VMware vCenter
Basic dashboard for VMWare metrics pulled by telegraf.
VMWare input for telegraf is available since telegraf 1.8.
Very basic dashboard for now:
- Allows you to choose hypervisor / vm
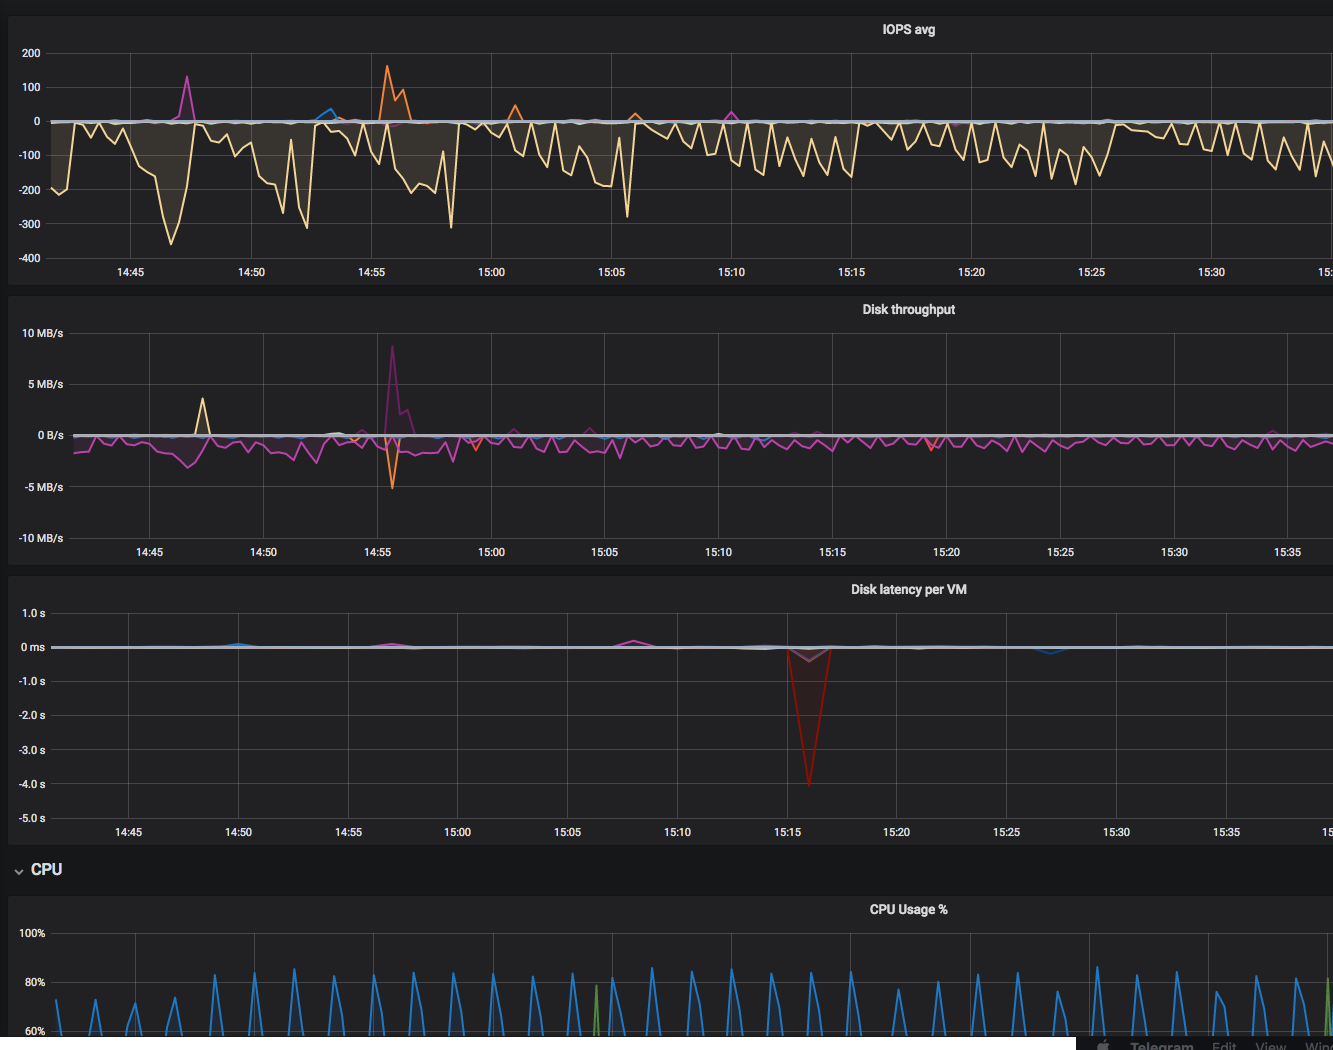
- Disk (bandwidth, latency and IOPS) usage per VM
- CPU usage per VM
- Memory usage per VM (graph looks weird now, i probably picked wrong metric for provisioned memory)
- Network (bandwidth and packets) usage per VM
Data source config
Collector type:
Collector plugins:
Collector config:
Revisions
Upload an updated version of an exported dashboard.json file from Grafana
| Revision | Description | Created | |
|---|---|---|---|
| Download |
VMware vSphere
Easily monitor VMware vSphere, a virtualization platform that helps consolidate IT infrastructure, with Grafana Cloud's out-of-the-box monitoring solution.
Learn more