Java/Weblogic Metrics
This Dashboard displays the information about Java Heap, JDBC Data Sources and Java Threads.
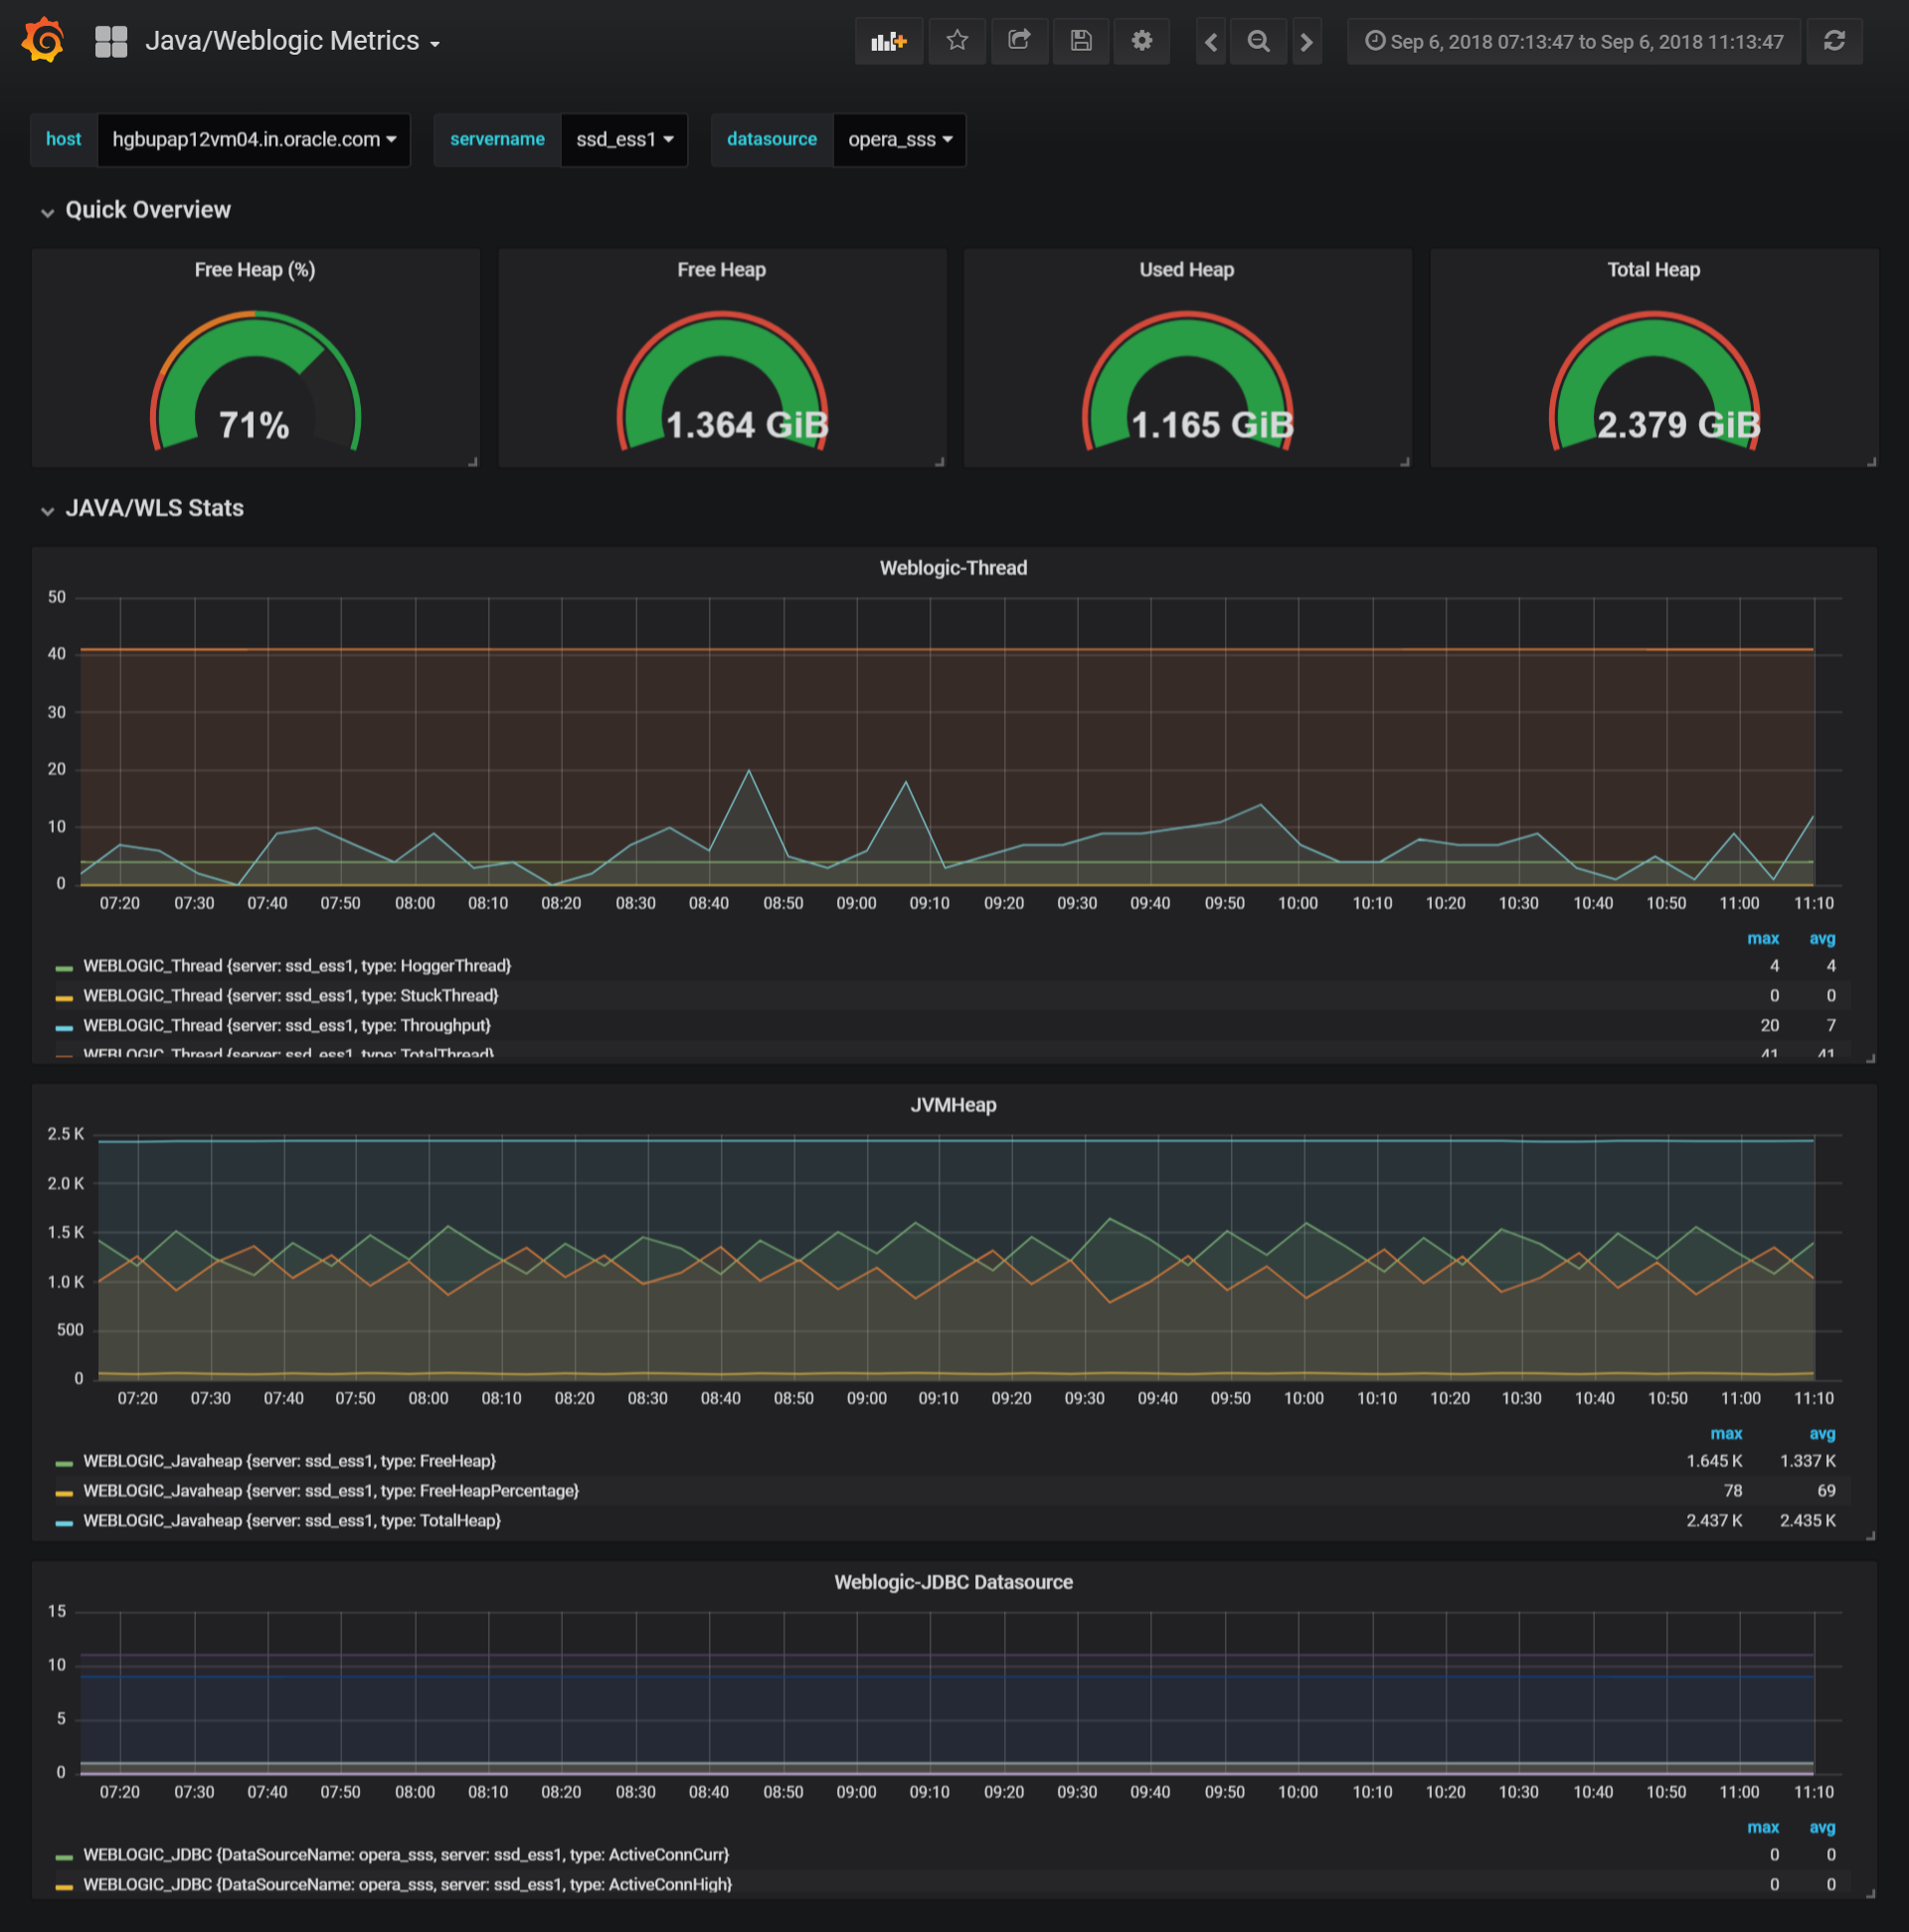
This Dashboard displays the information about Java Heap, JDBC Data Sources and Java Threads. It is based on custom scripts which fetches the data during run-time and stored in the Influx DB.
Data source config
Collector type:
Collector plugins:
Collector config:
Revisions
Upload an updated version of an exported dashboard.json file from Grafana
| Revision | Description | Created | |
|---|---|---|---|
| Download |