FRITZ!Box Router Status
Monitor FRITZ!Box routers.
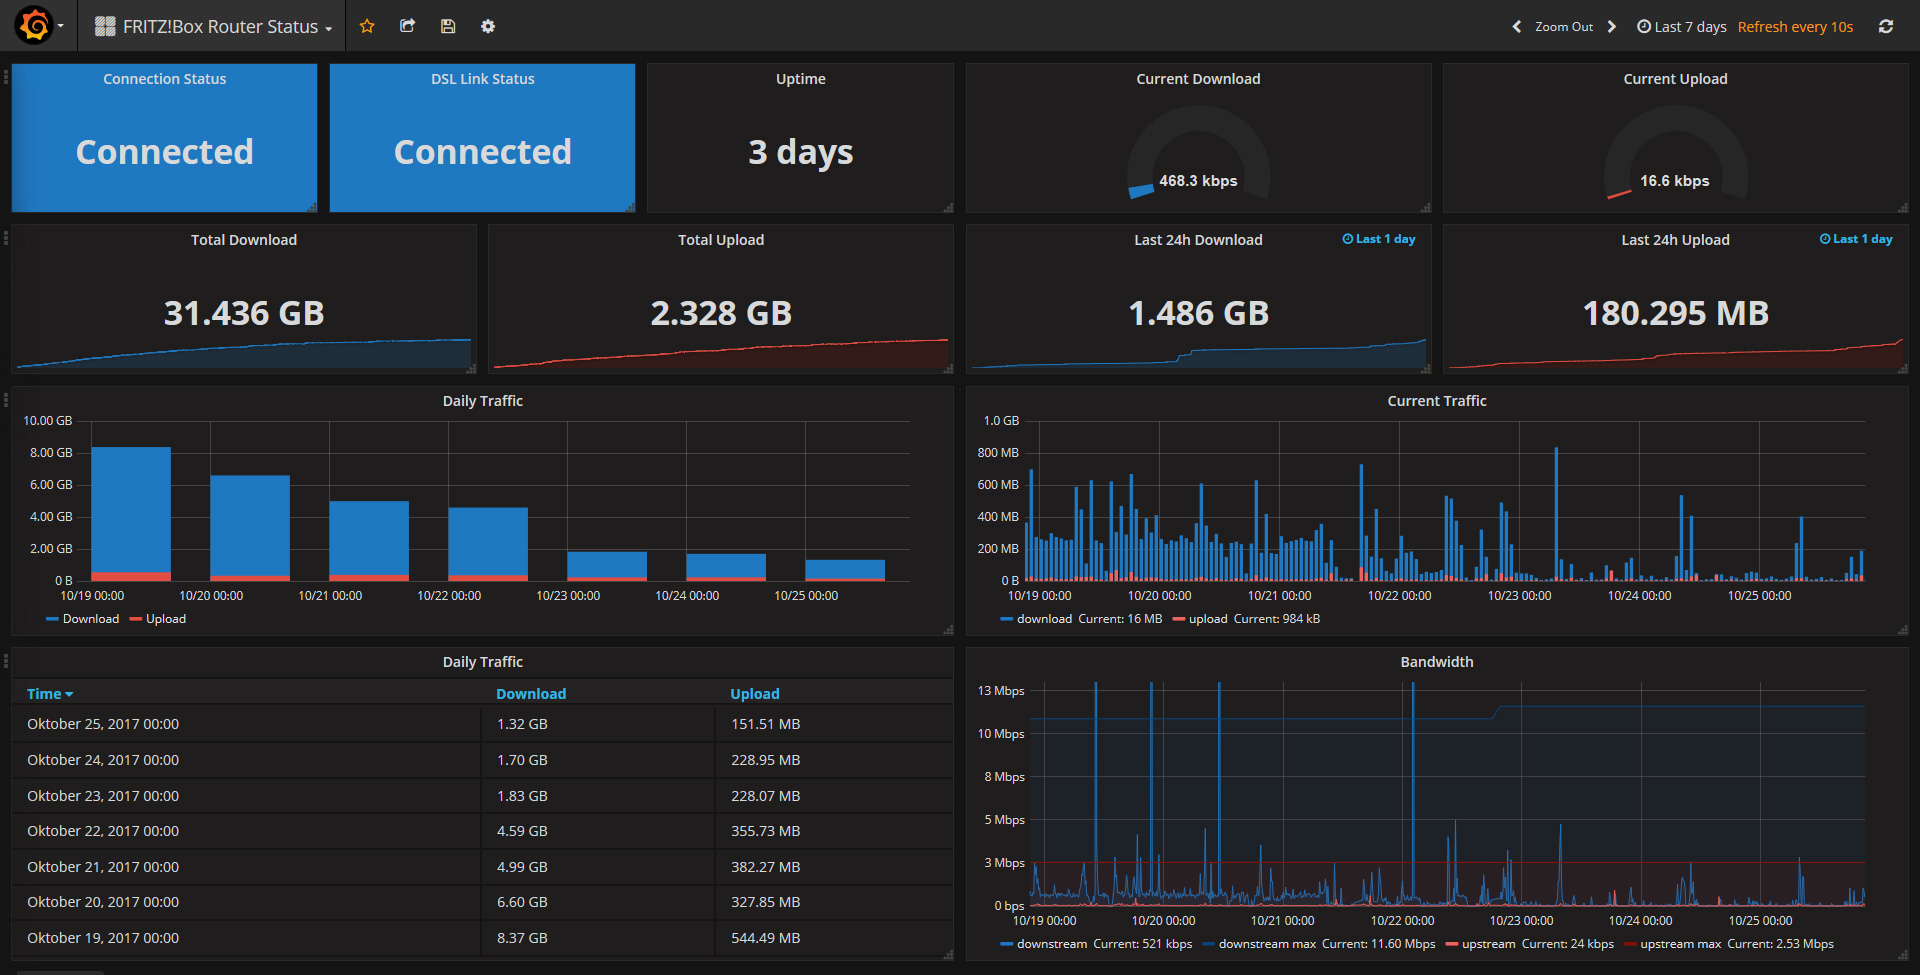
This dashboard demonstrates the usage of collectd with the fritzcollectd Plugin that allows to monitor FRITZ!Box routers.
More information about the plugin can be found in the blog post "fritzcollectd - A collectd plugin to monitor FRITZ!Box routers". The installation and configuration is described on the project's GitHub Page: https://github.com/fetzerch/fritzcollectd.
Note that the dashboard requires InfluxDB 1.3.0 or higher. Some graphs like "Daily Traffice" show "no data points" at the beginning. It may take a while until enough data has been collected.
Data source config
Collector type:
Collector plugins:
Collector config:
Revisions
Upload an updated version of an exported dashboard.json file from Grafana
| Revision | Description | Created | |
|---|---|---|---|
| Download |