Analysis by Pod
Part 3 of 3 dashboards to help you visualise your kubernetes costs.
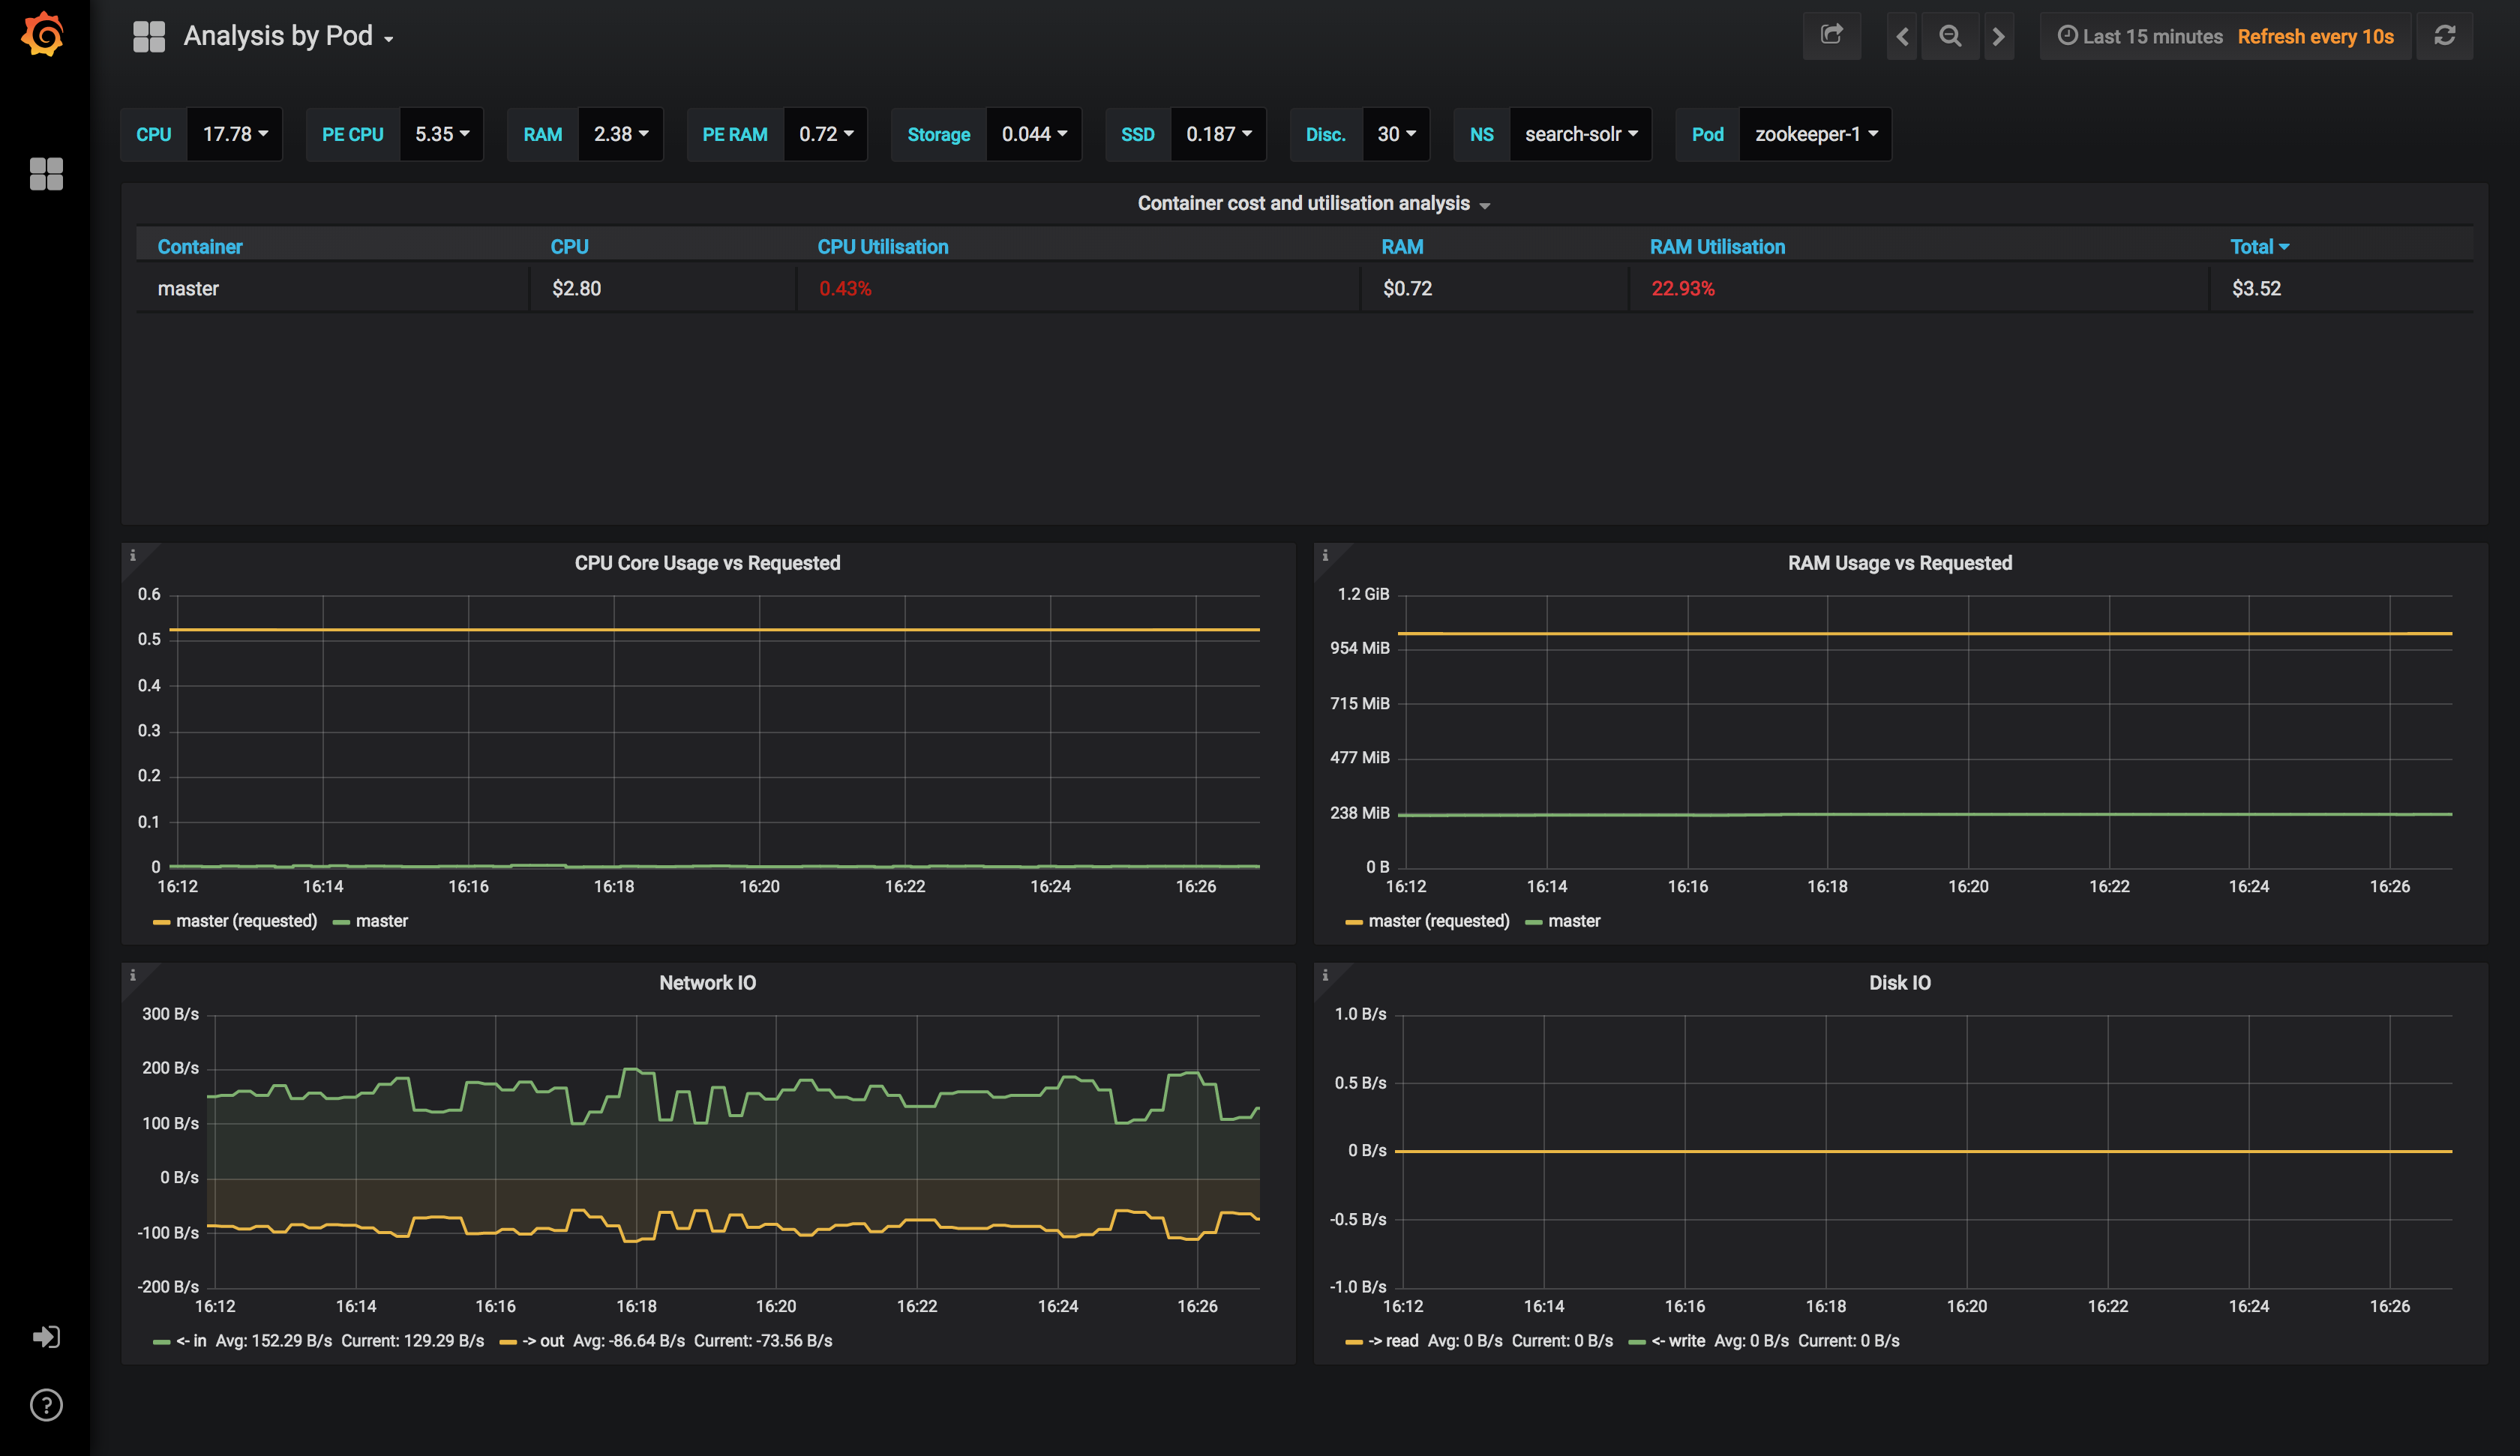
This is part 3 of 3 dashboards to help you visualise cost on kubernetes.
Please see my blog post: https://karlstoney.com/2018/07/07/managing-your-costs-on-kubernetes for more information
Data source config
Collector type:
Collector plugins:
Collector config:
Revisions
Upload an updated version of an exported dashboard.json file from Grafana
| Revision | Description | Created | |
|---|---|---|---|
| Download |