Status de serviços
Dashboard com: Alerta de Incidentes, Espaço em Disco, CPU, Temperatura (usando lm-sensors no Linux) e Algumas informações do Zabbix Server.
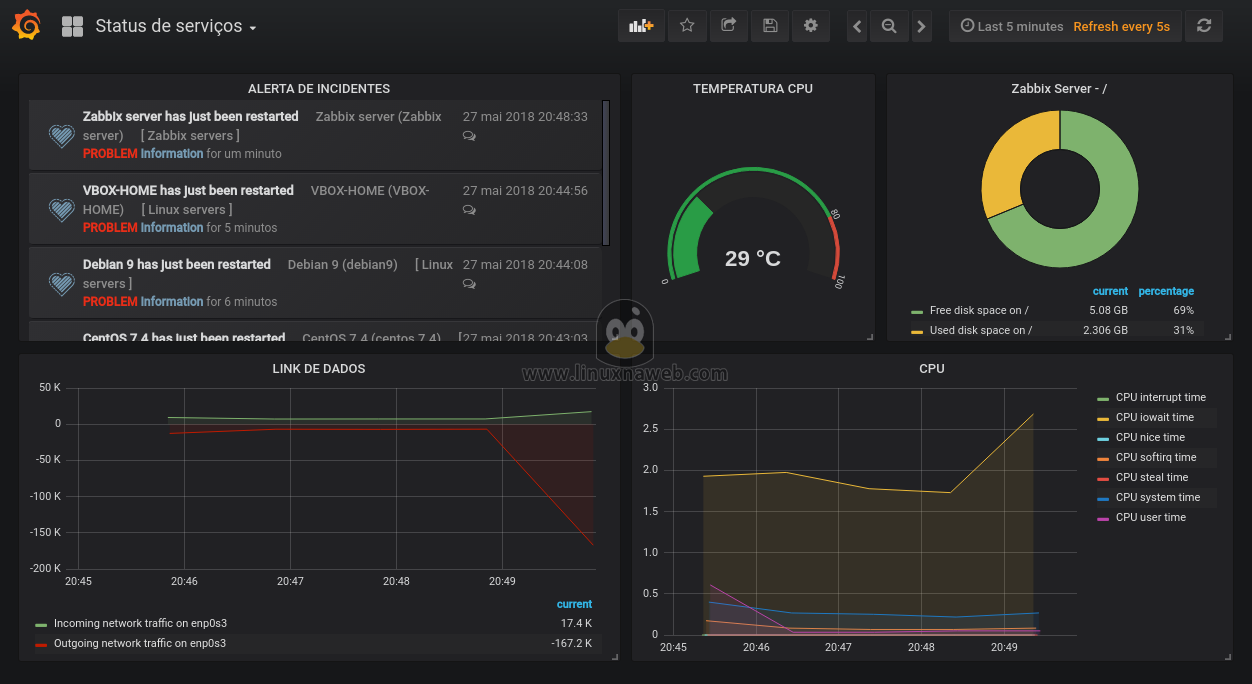
The Status de serviços dashboard uses the alexanderzobnin-zabbix-datasource data source to create a Grafana dashboard with the alexanderzobnin-zabbix-triggers-panel, grafana-piechart-panel, graph and singlestat panels.
Data source config
Collector type:
Collector plugins:
Collector config:
Revisions
Upload an updated version of an exported dashboard.json file from Grafana
| Revision | Description | Created | |
|---|---|---|---|
| Download |