VCenter VirtualMachine details
A nice per-Host VM overview of VCenter VMware performance metrics.
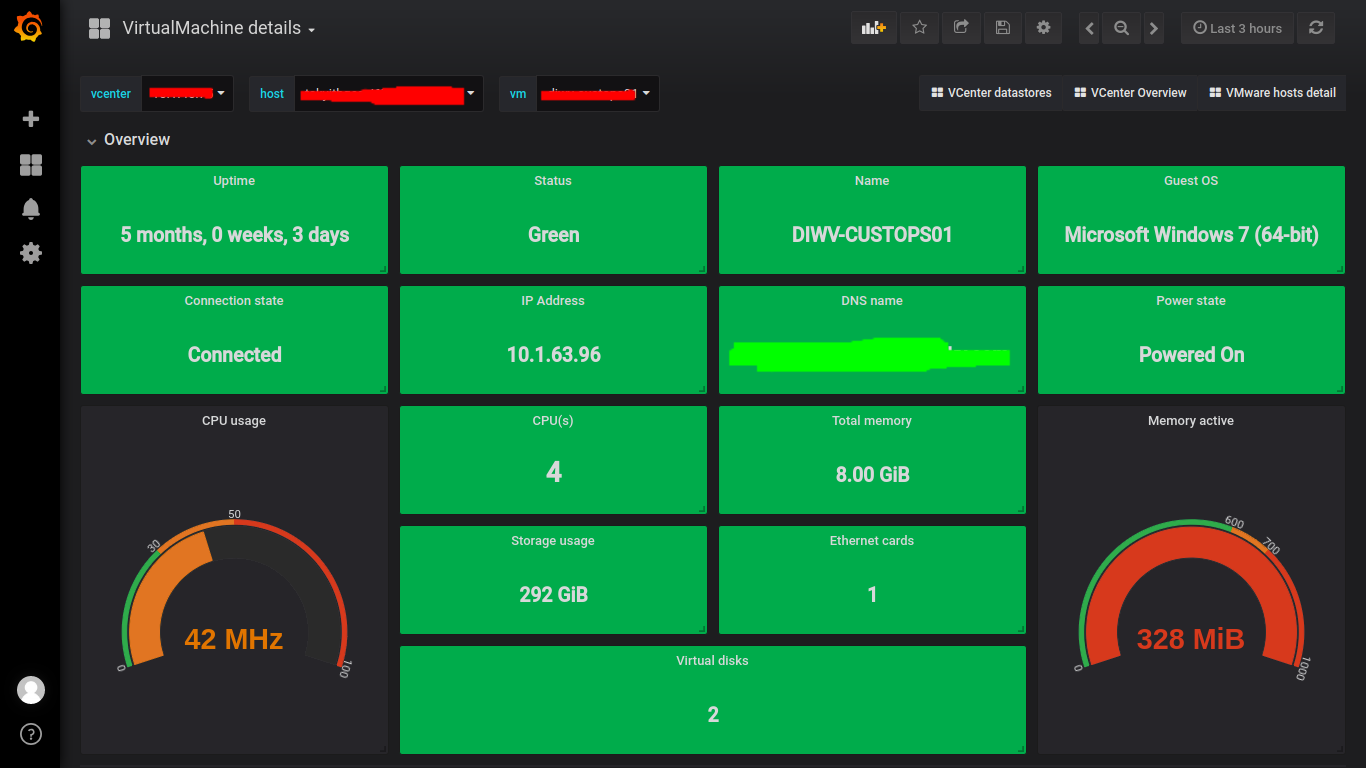
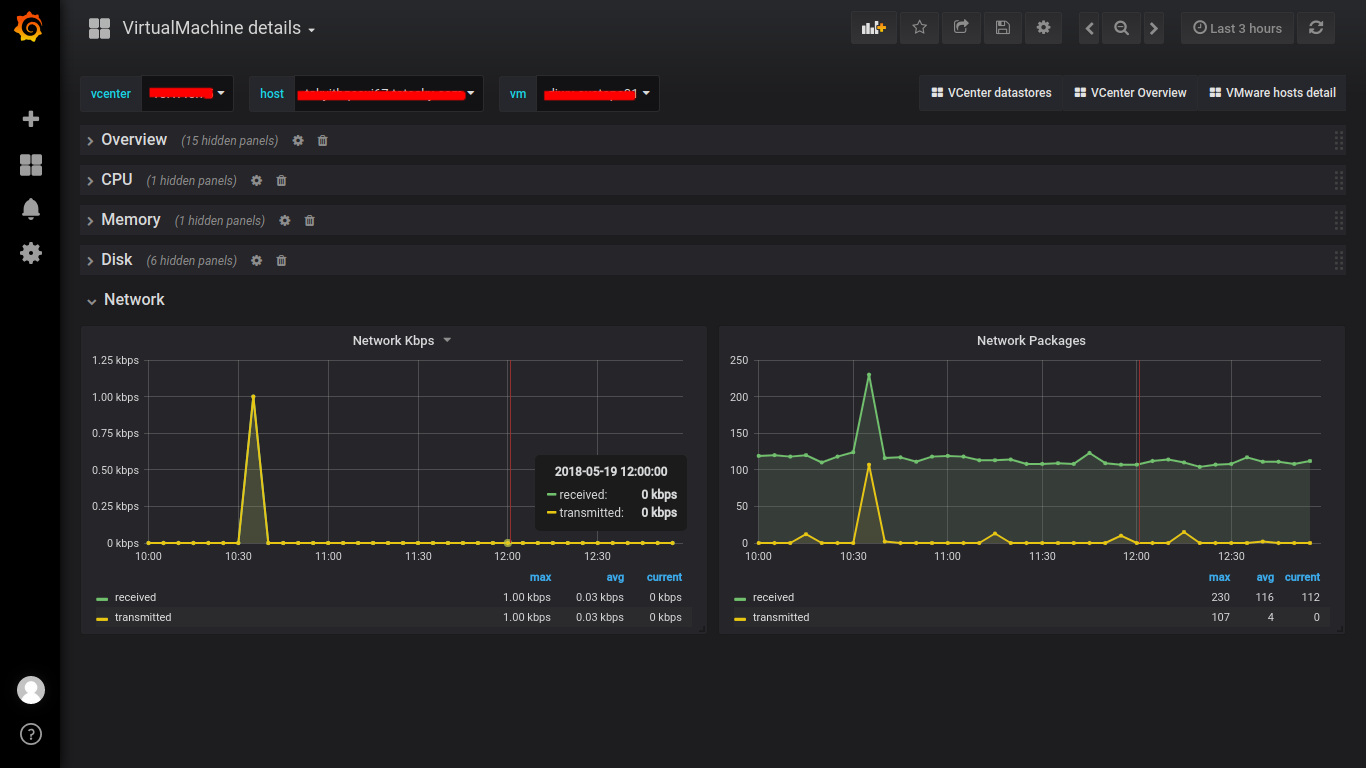
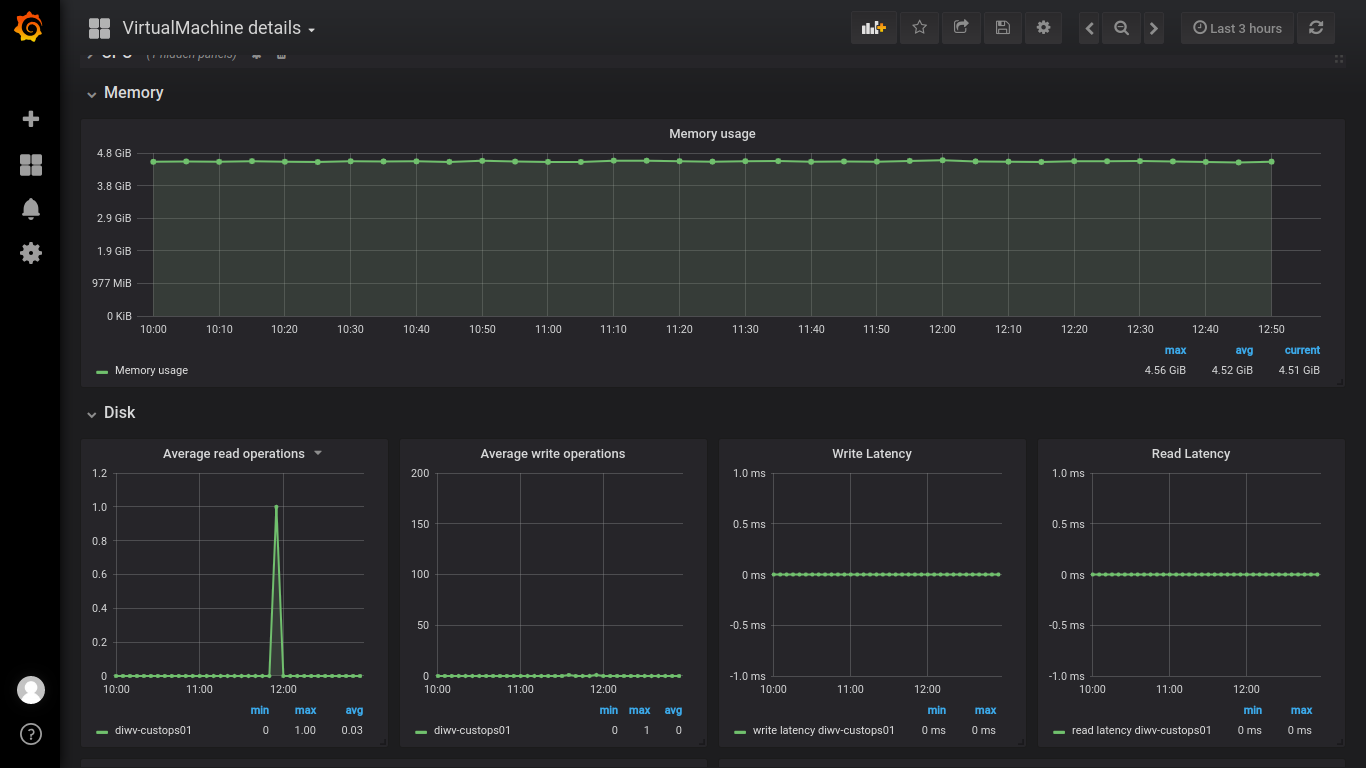
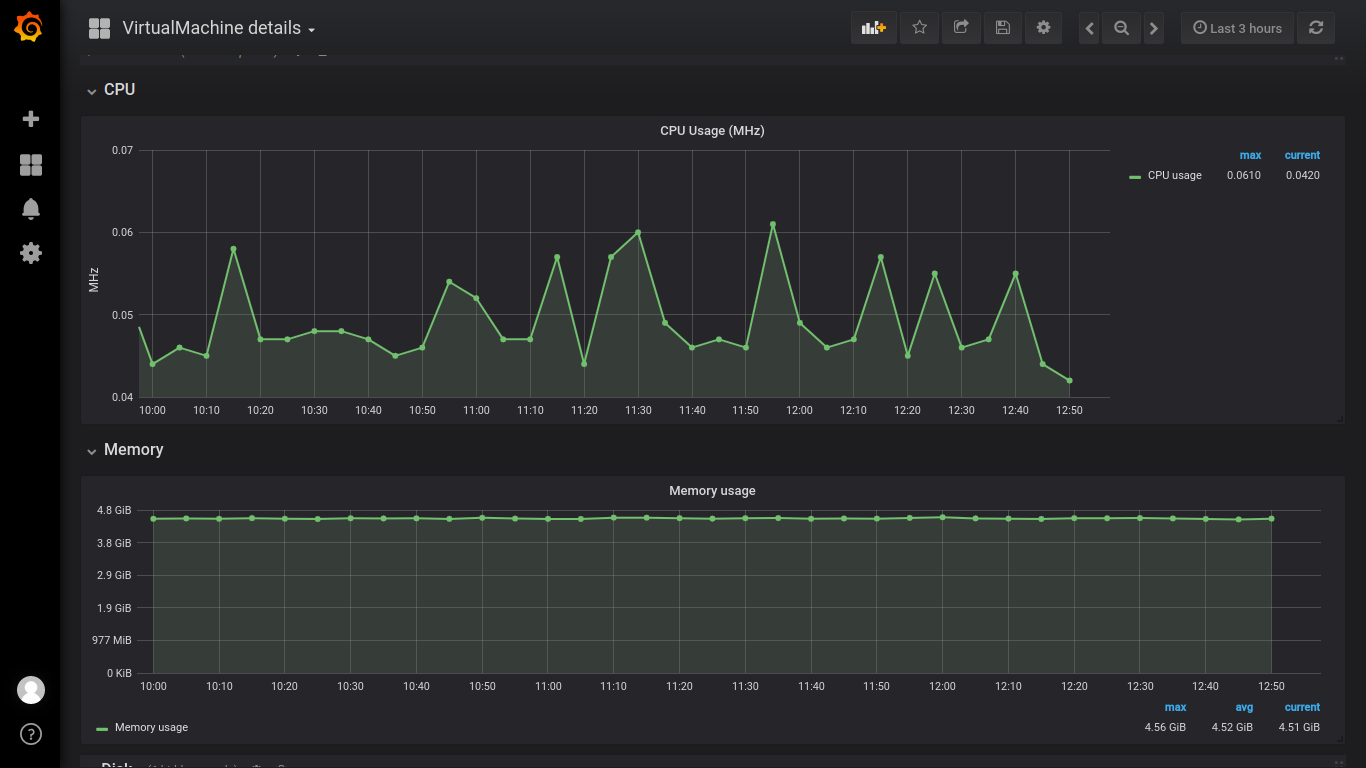
VMware hosts detail Dashboard is the third of the 4 series dashboards for VCenter monitoring. It shows the Overview (uptime,cpu's,memory...), CPU, Memory, Disk, Network statistics for VM. It is built on Grafana 5 release. The collector used was vsphere-vcenter-influx-go (https://github.com/vikramjakhr/vsphere-vcenter-influx-go)
Data source config
Collector type:
Collector plugins:
Collector config:
Revisions
Upload an updated version of an exported dashboard.json file from Grafana
| Revision | Description | Created | |
|---|---|---|---|
| Download |