node-monitor
物理机秒级监控页面
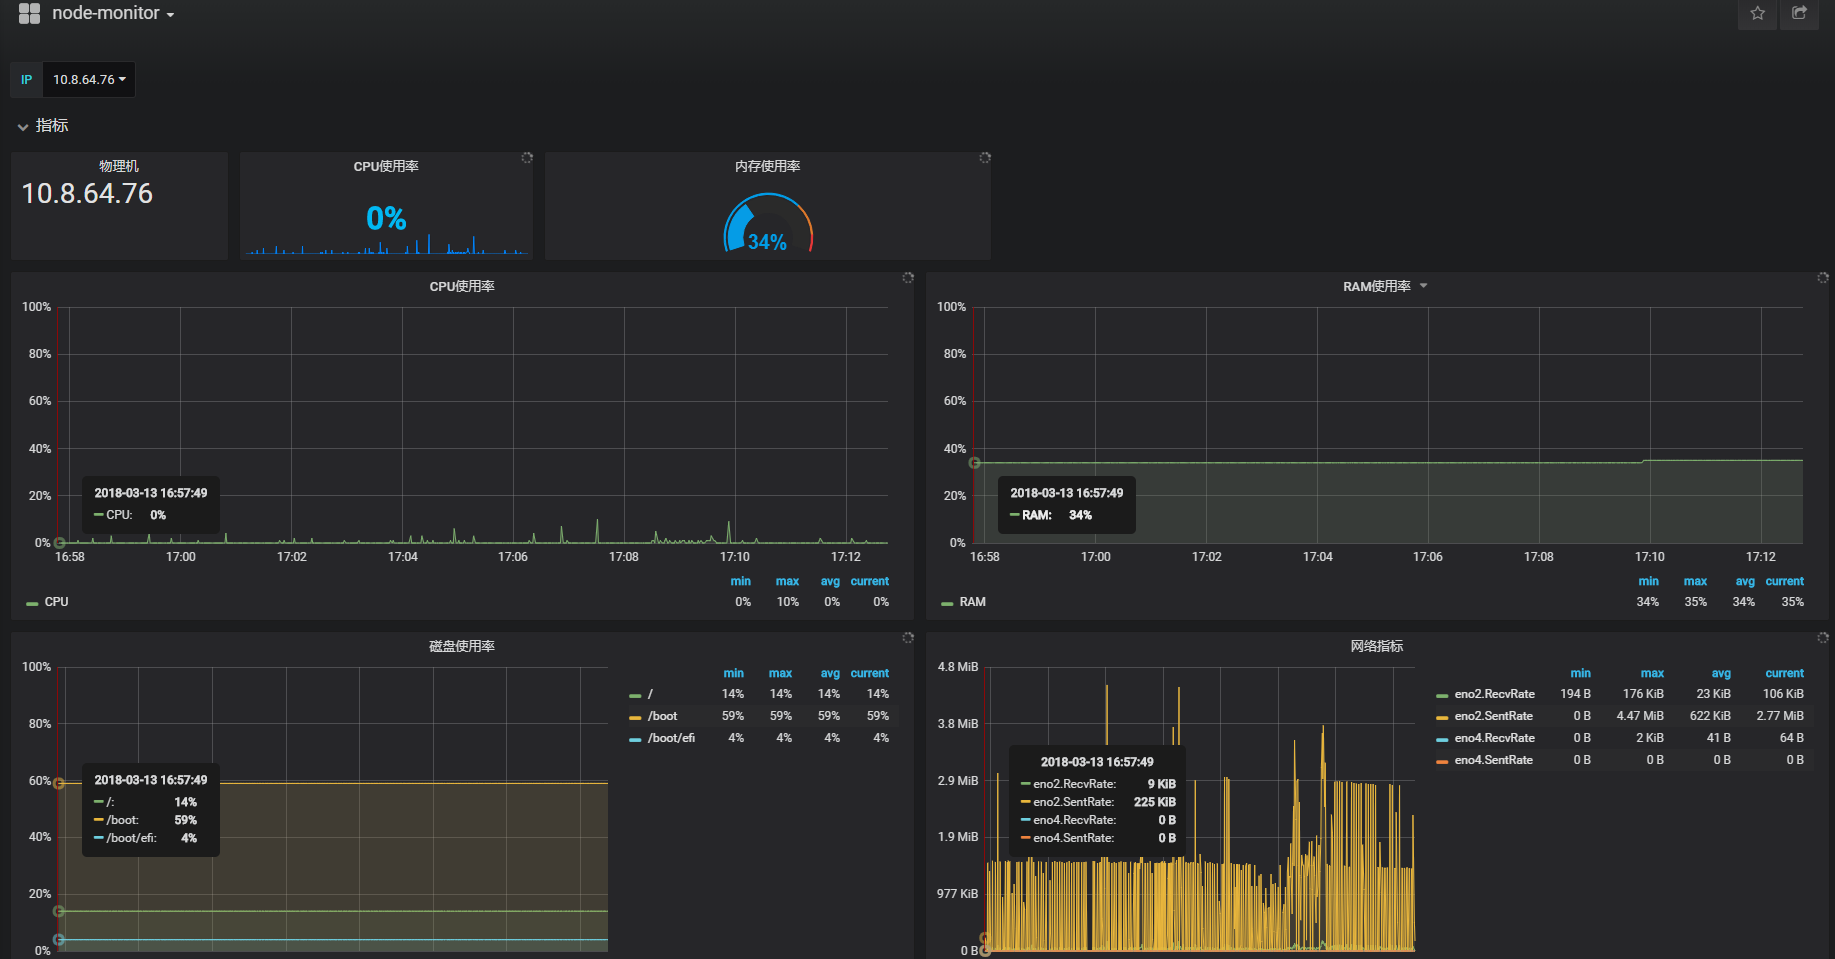
The node-monitor dashboard uses the grafana-simple-json-datasource data source to create a Grafana dashboard with the graph, singlestat and text panels.
Data source config
Collector type:
Collector plugins:
Collector config:
Revisions
Upload an updated version of an exported dashboard.json file from Grafana
| Revision | Description | Created | |
|---|---|---|---|
| Download |
Linux Server
Monitor Linux with Grafana. Easily monitor your Linux deployment with Grafana Cloud's out-of-the-box monitoring solution.
Learn more