Three Node Performance Food Groups Enhanced
Same as Three Node Performance Food groups but includes a few more metrics (load, uptime, swap, iops, io throughput, df, network pps).
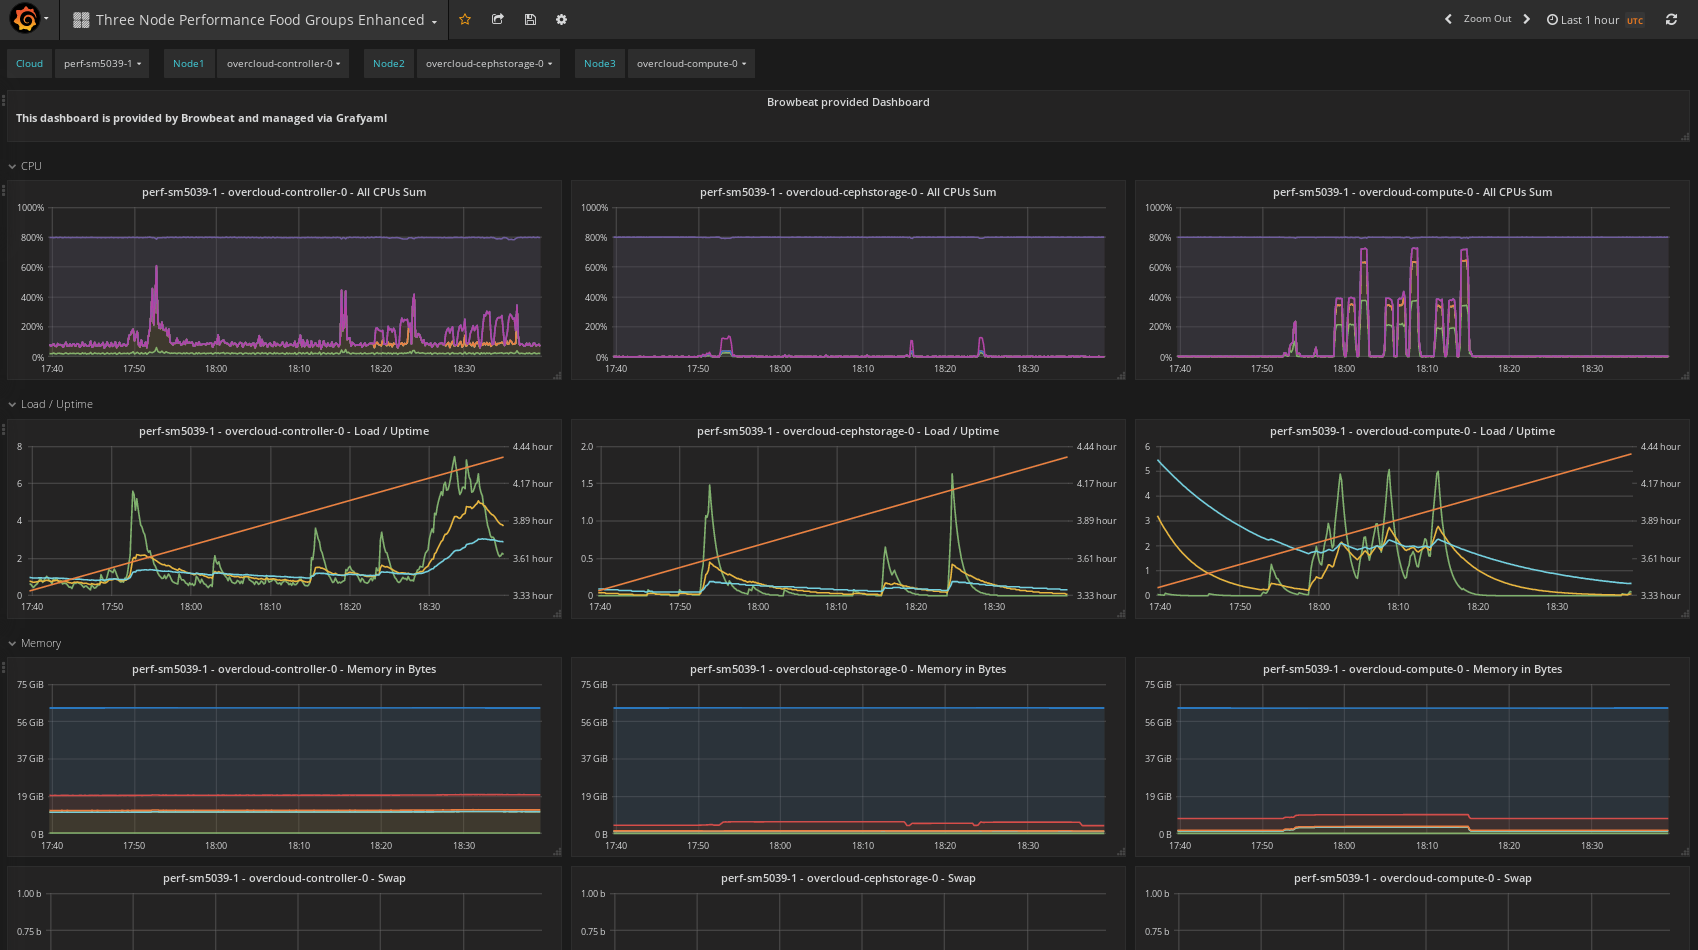
The Three Node Performance Food Groups Enhanced dashboard uses the graphite data source to create a Grafana dashboard with the graph and text panels.
Data source config
Collector type:
Collector plugins:
Collector config:
Revisions
Upload an updated version of an exported dashboard.json file from Grafana
| Revision | Description | Created | |
|---|---|---|---|
| Download |
Linux Server
Monitor Linux with Grafana. Easily monitor your Linux deployment with Grafana Cloud's out-of-the-box monitoring solution.
Learn more