Three Node Performance Food Groups
Displays CPU, Memory, Disk, and Network metrics from three nodes in nice format.
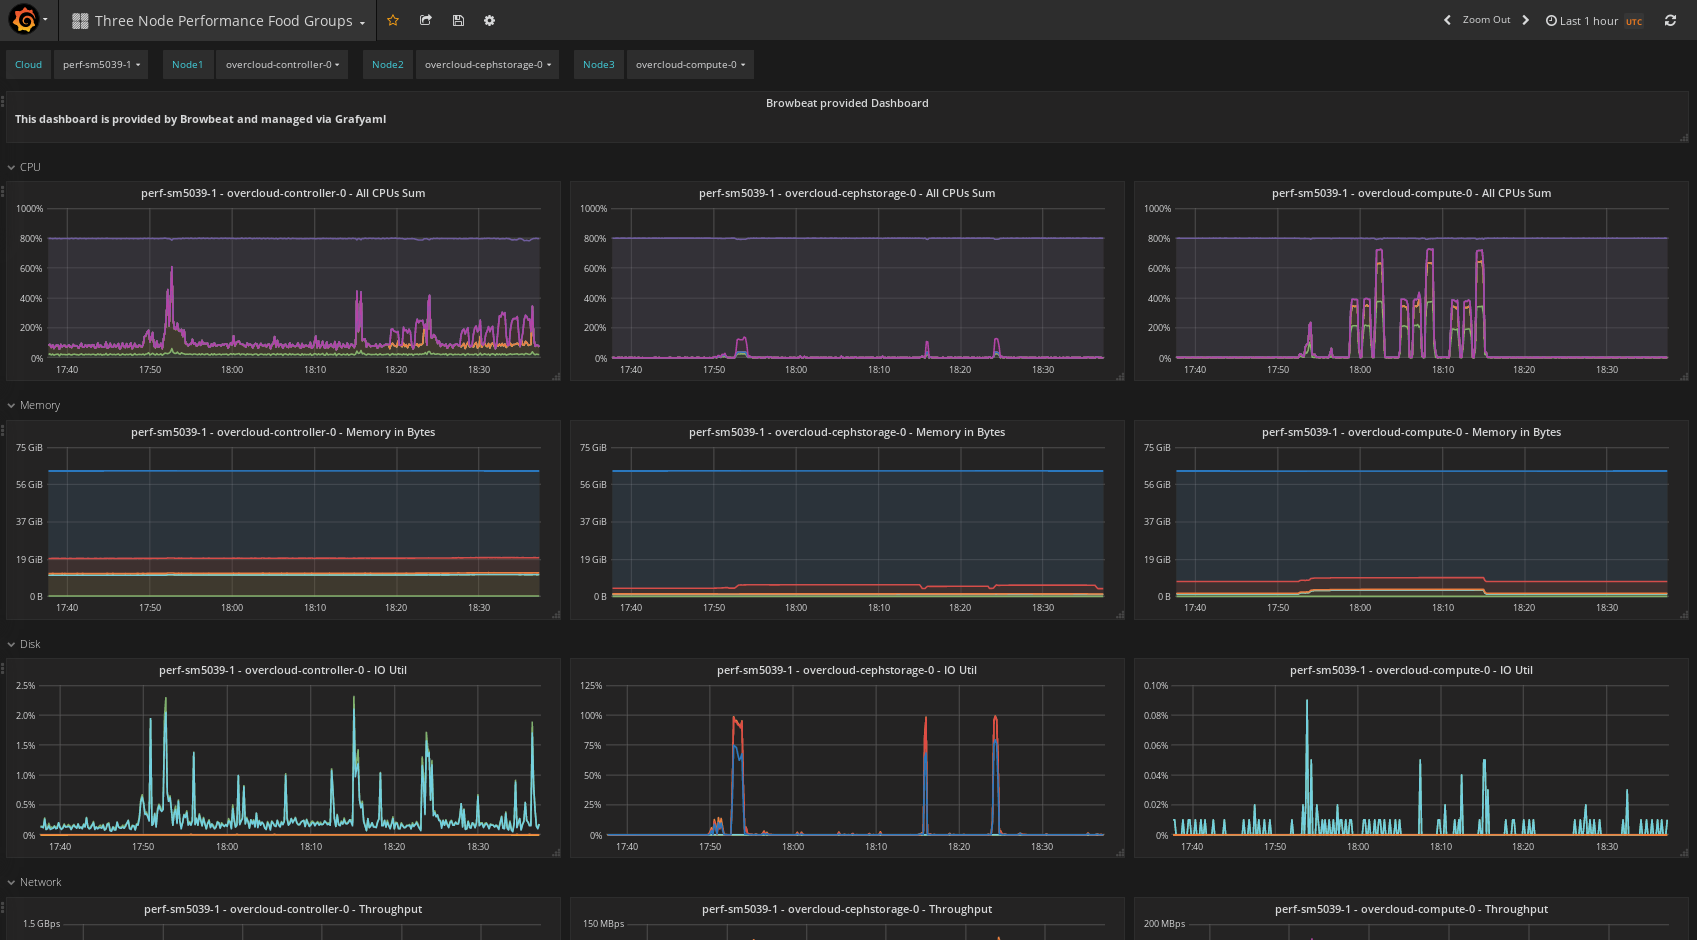
The Three Node Performance Food Groups dashboard uses the graphite data source to create a Grafana dashboard with the graph and text panels.
Data source config
Collector type:
Collector plugins:
Collector config:
Revisions
Upload an updated version of an exported dashboard.json file from Grafana
| Revision | Description | Created | |
|---|---|---|---|
| Download |
Linux Server
Monitor Linux with Grafana. Easily monitor your Linux deployment with Grafana Cloud's out-of-the-box monitoring solution.
Learn more