Cloud System Performance Comparsion
Compares two nodes metrics over cpu, memory, disk, network, and per process metrics.
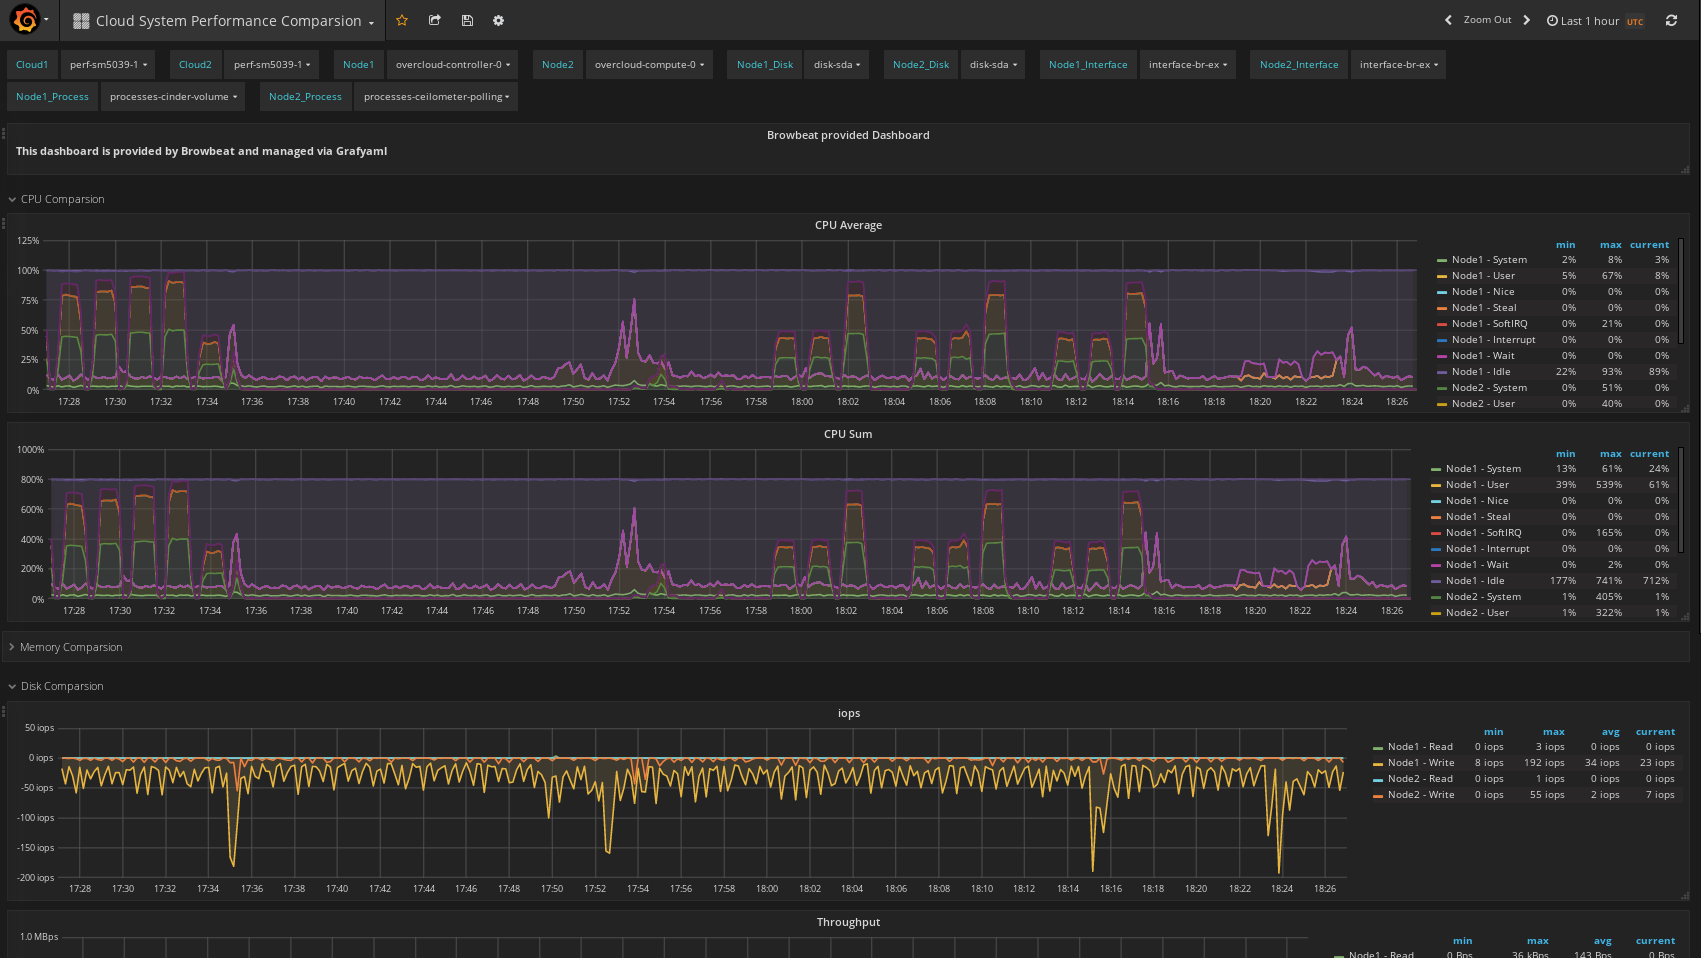
The Cloud System Performance Comparsion dashboard uses the graphite data source to create a Grafana dashboard with the graph and text panels.
Data source config
Collector type:
Collector plugins:
Collector config:
Revisions
Upload an updated version of an exported dashboard.json file from Grafana
| Revision | Description | Created | |
|---|---|---|---|
| Download |