Cloud Gnocchi Performance
Displays Metrics related to how OpenStack Telemetry is performing.
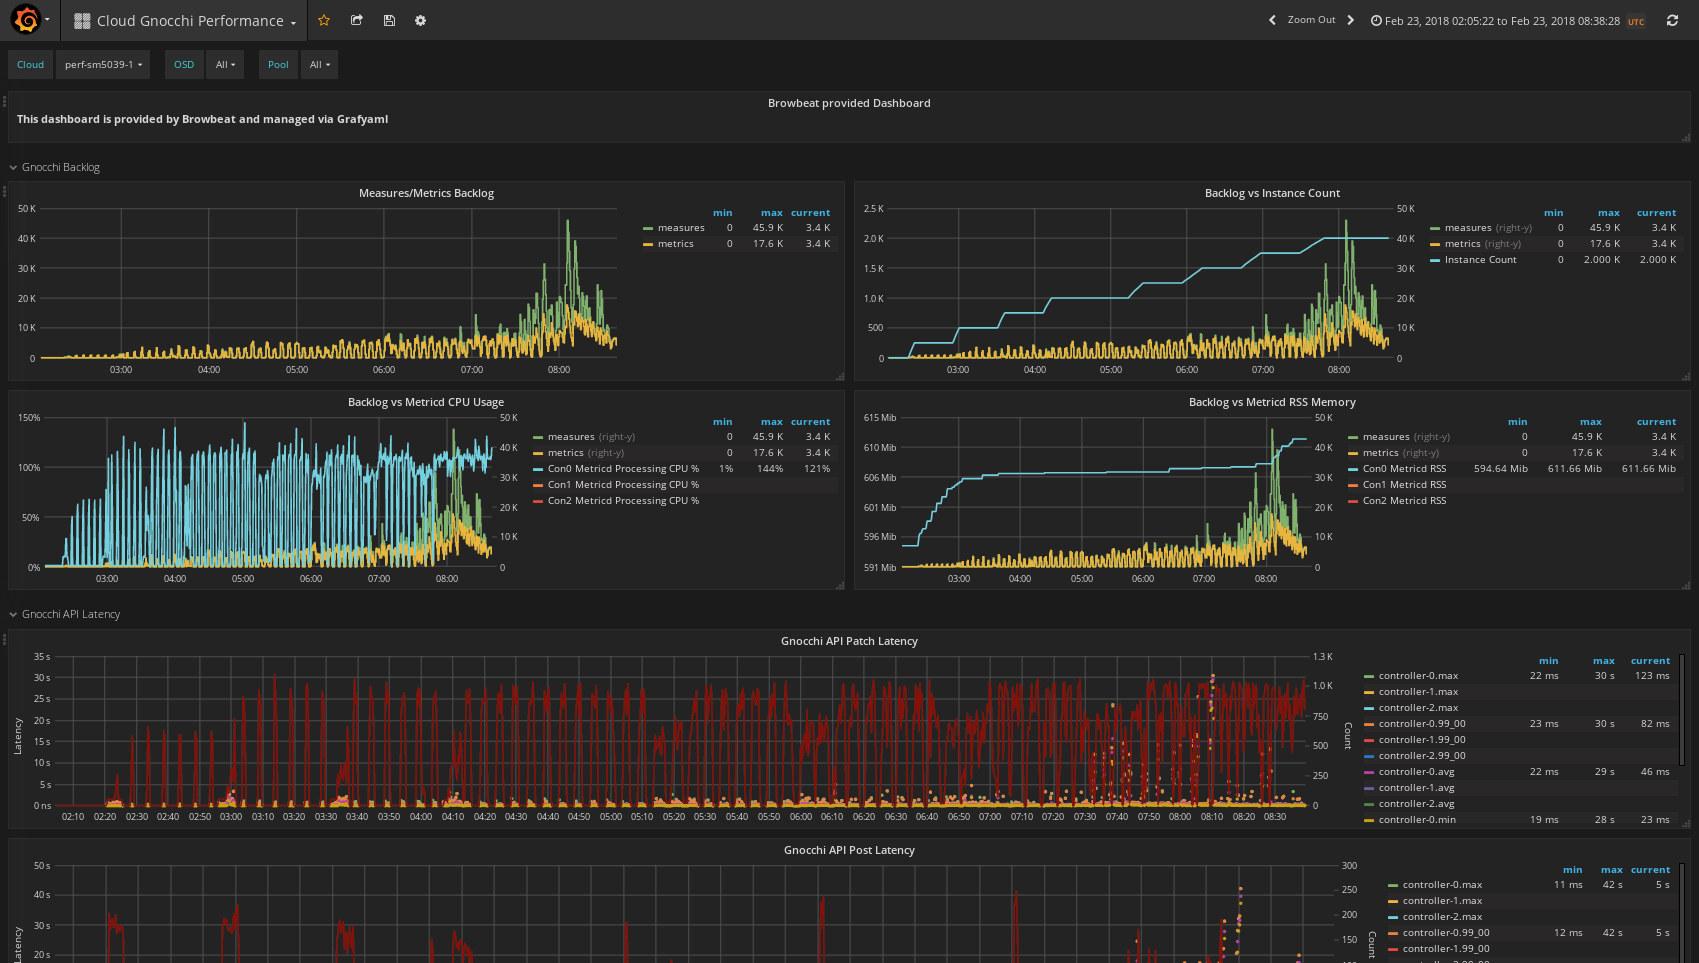
The Cloud Gnocchi Performance dashboard uses the graphite data source to create a Grafana dashboard with the graph and text panels.
Data source config
Collector type:
Collector plugins:
Collector config:
Revisions
Upload an updated version of an exported dashboard.json file from Grafana
| Revision | Description | Created | |
|---|---|---|---|
| Download |