Apache Request Latency
Displays Request Timing for requests made to Apache Hosted services for OpenStack (Gnocchi, Keystone Admin, Keystone Main, Nova placement api)
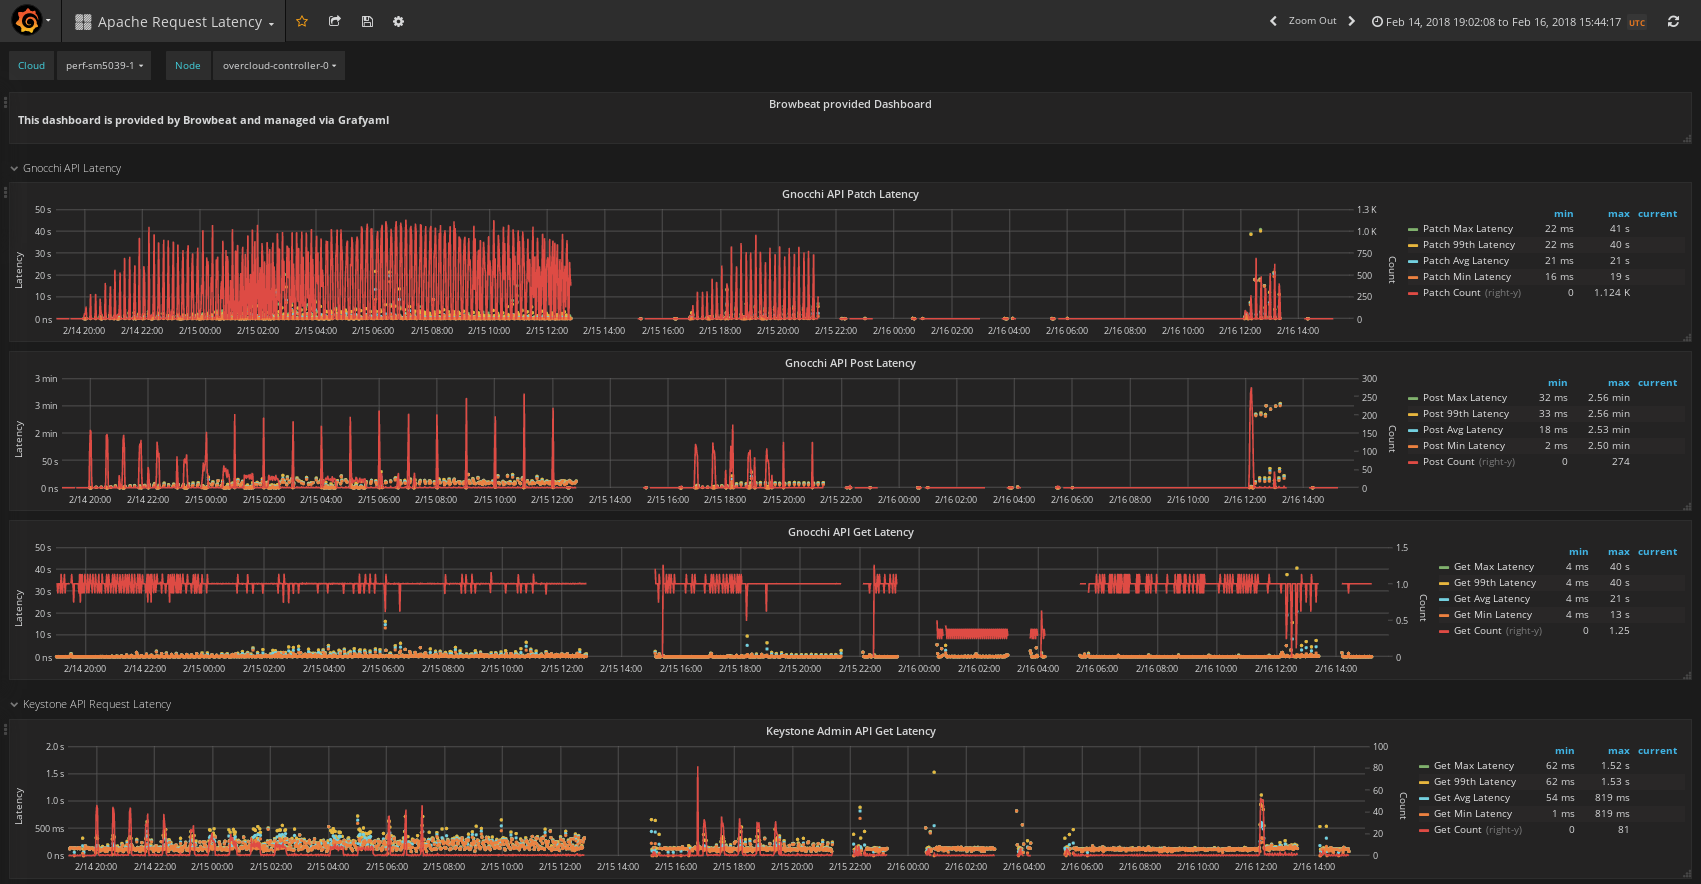
The Apache Request Latency dashboard uses the graphite data source to create a Grafana dashboard with the graph and text panels.
Data source config
Collector type:
Collector plugins:
Collector config:
Revisions
Upload an updated version of an exported dashboard.json file from Grafana
| Revision | Description | Created | |
|---|---|---|---|
| Download |