Huawei WLAN FAT AP
A dashboard for the Huawei WLAN FAT AP
Huawei_FatAP_Grafana
A templated Dashboard for Huawei Fat WLAN AP in Grafana
Dependencies InfluxDB as the time-series database and Telegraf as the collector should be installed.
More info see my blog For all latest files, see My GitHub page
Quick Start
- Enable SNMP on your Huawei WLAN FAT Accespoint
- Put hw_fatap.conf in your
/etc/telegraf/telegraf.ddirectory - Edit the community string as appropriate
- Edit the 'agents' list to include all of your monitored Fat WLAN Access points
- Put the files in the mibs dir
/usr/share/snmp/mibs - Import the Grafana dashboard json file
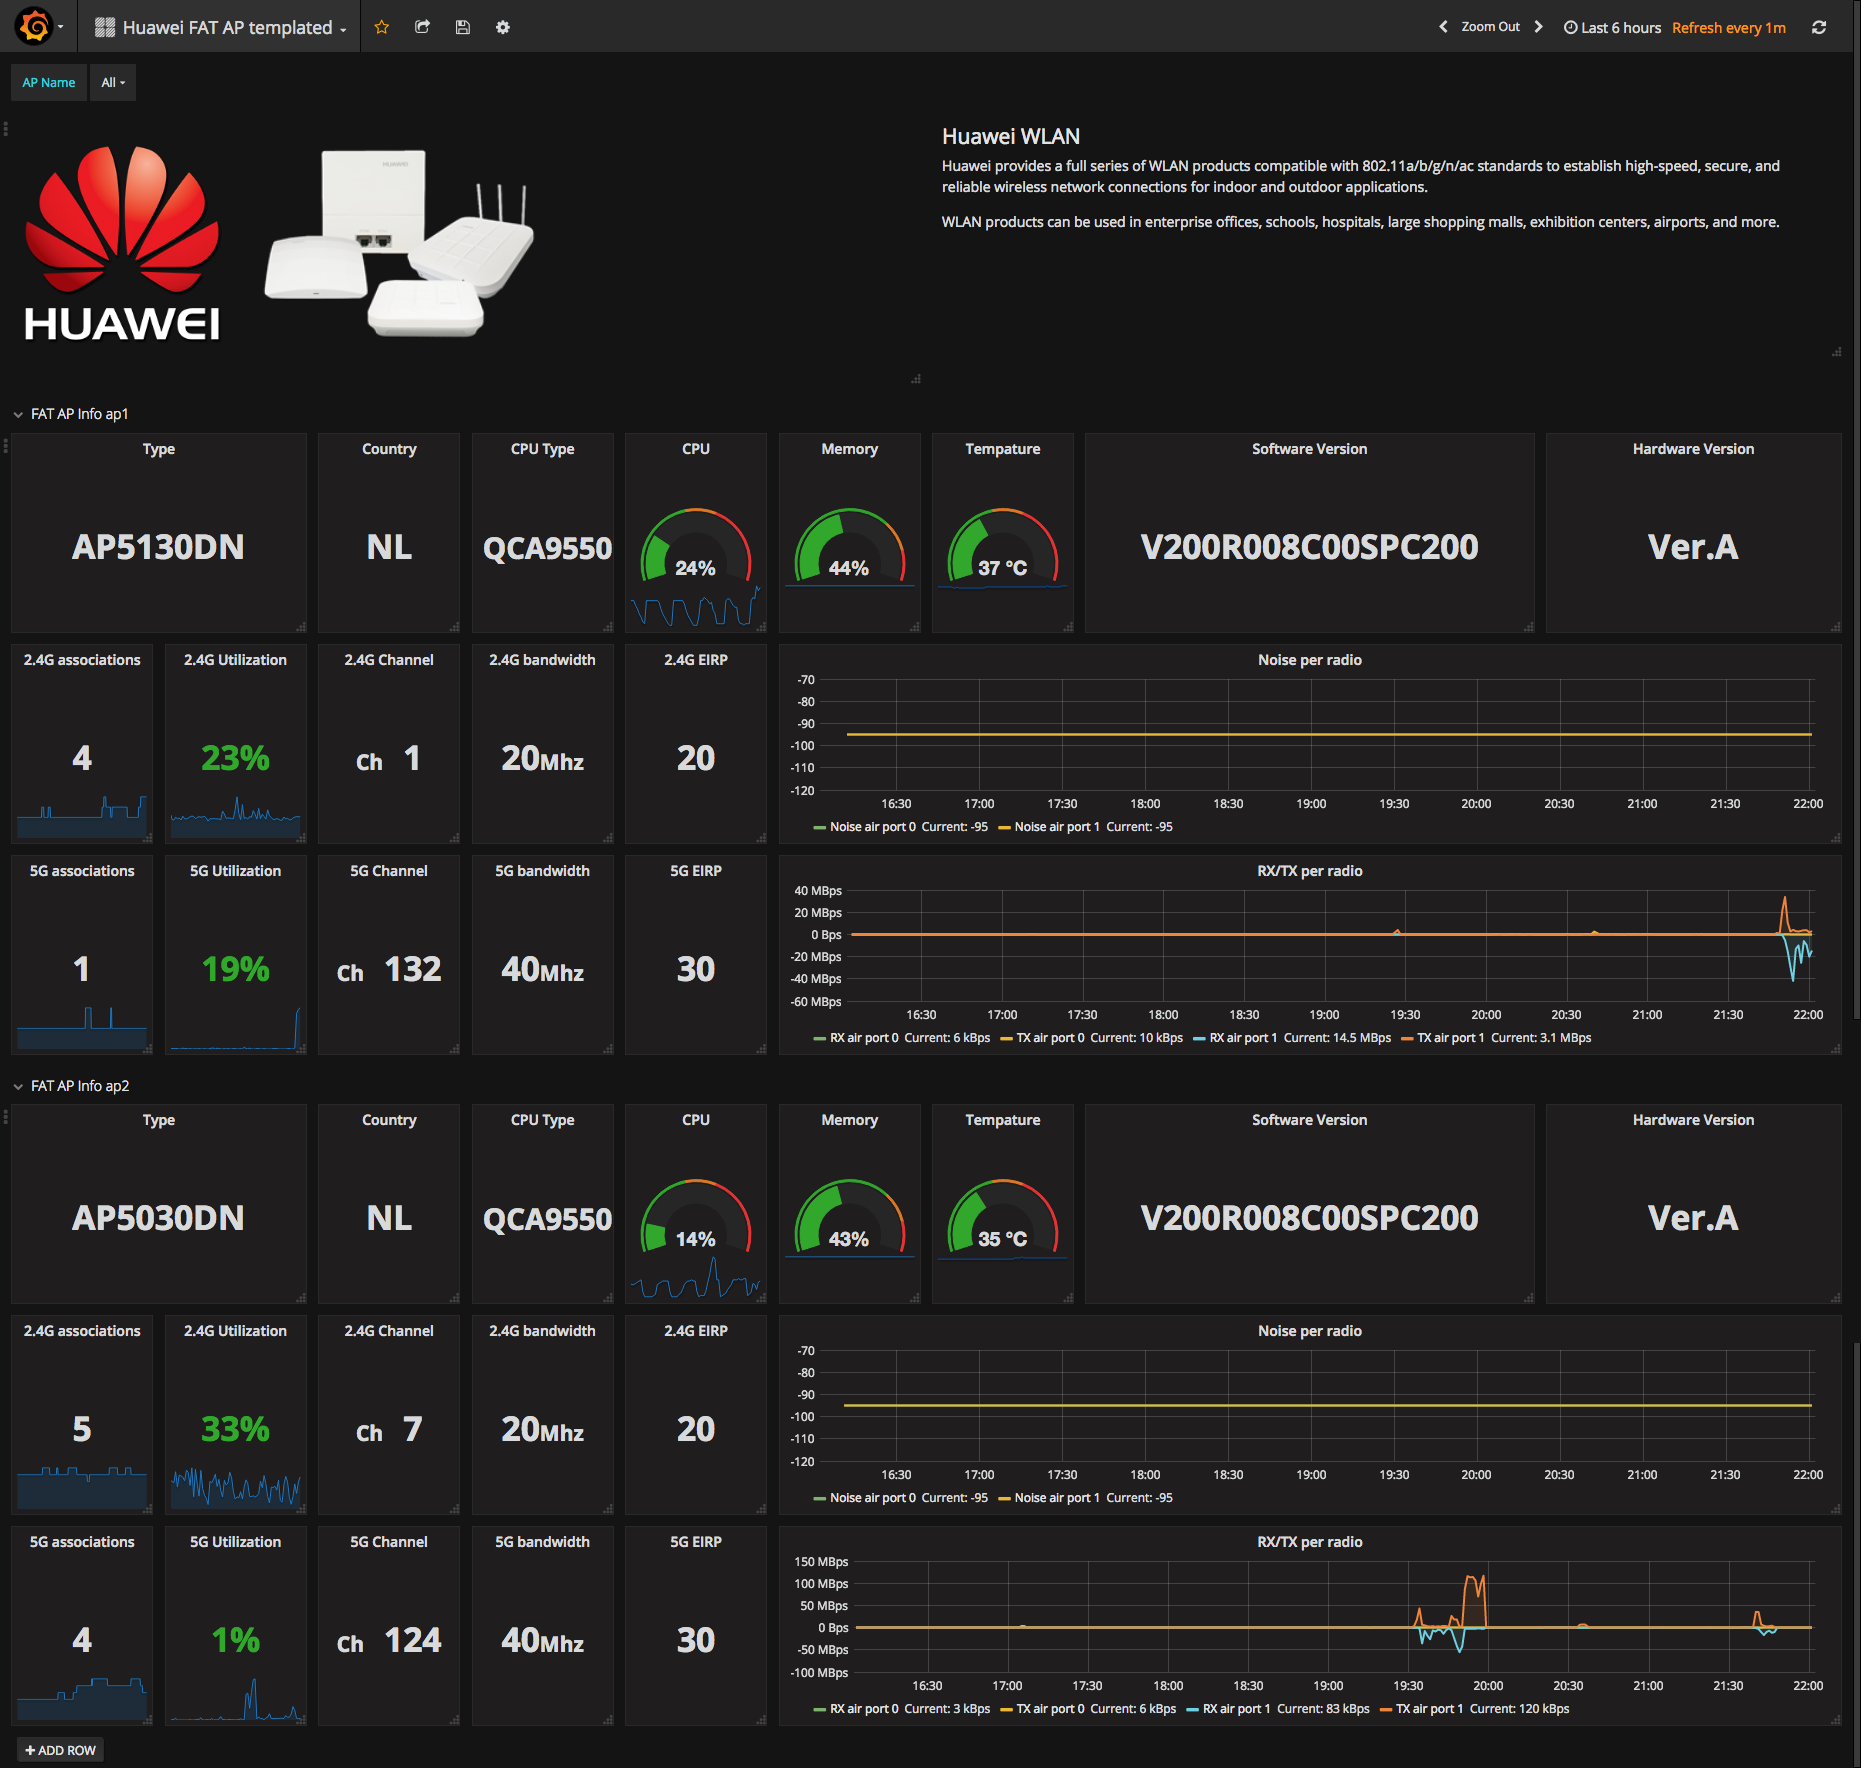
Screenshot
After you setup all, you should have some dashboard like this

Data source config
Collector type:
Collector plugins:
Collector config:
Revisions
Upload an updated version of an exported dashboard.json file from Grafana
| Revision | Description | Created | |
|---|---|---|---|
| Download |