LANGERMA: Elasticsearch Dashboard Correct
Elasticsearch Dashboard for 2.X and 5.X
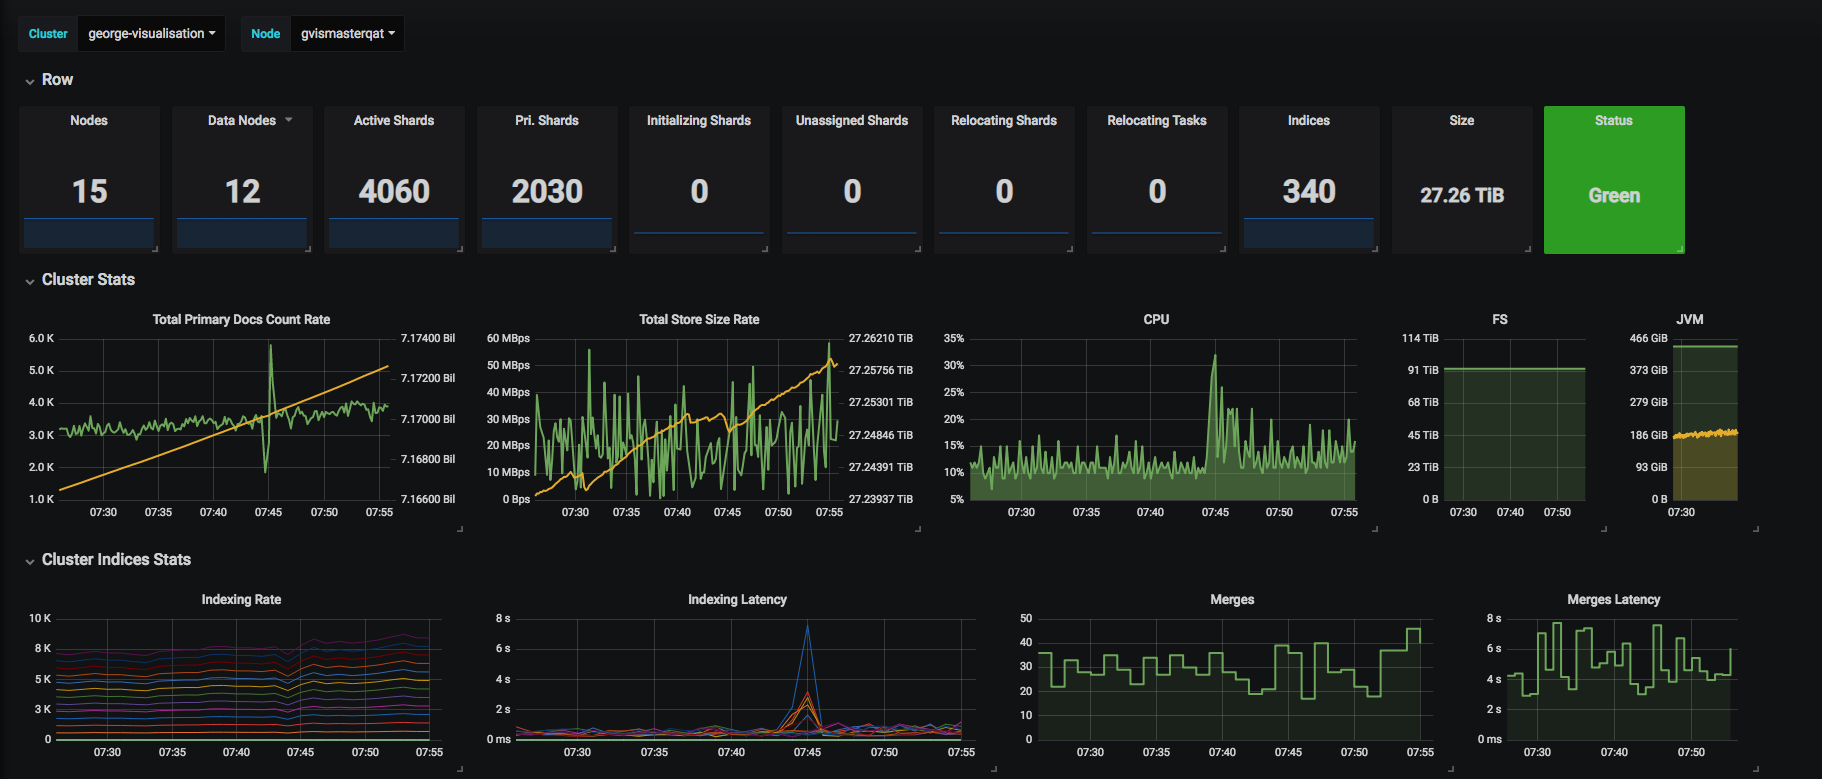
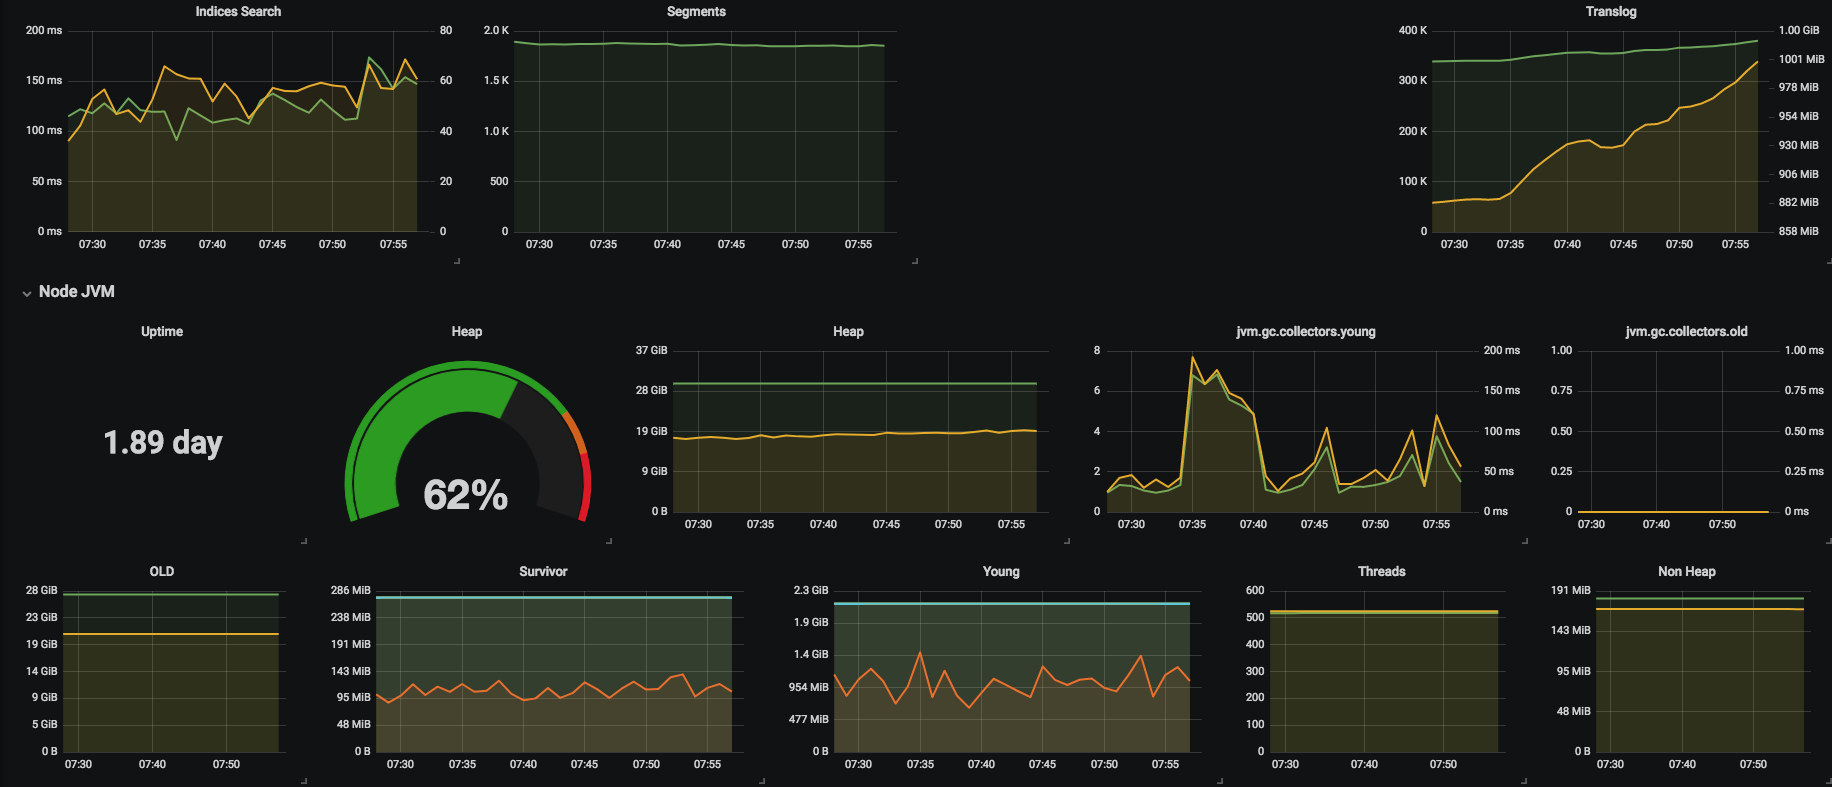
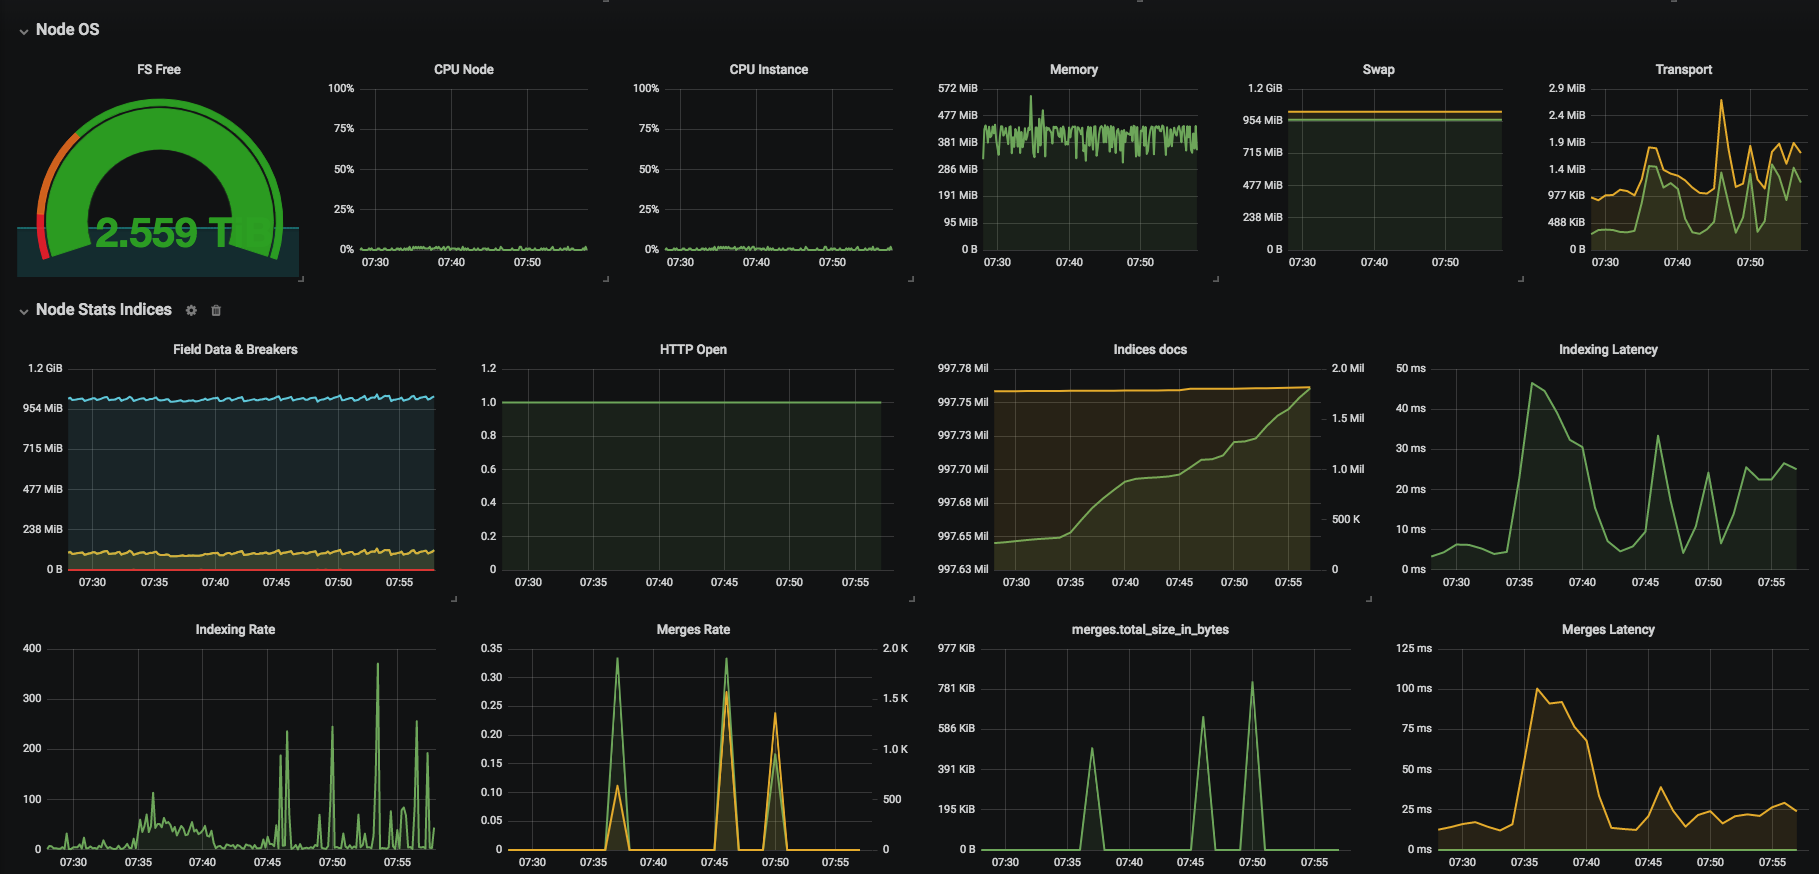
The LANGERMA: Elasticsearch Dashboard Correct dashboard uses the opentsdb data source to create a Grafana dashboard with the graph and singlestat panels.
Data source config
Collector type:
Collector plugins:
Collector config:
Revisions
Upload an updated version of an exported dashboard.json file from Grafana
| Revision | Description | Created | |
|---|---|---|---|
| Download |
Elasticsearch
Easily monitor Elasticsearch, a distributed, multitenant full-text search engine, with Grafana Cloud's out-of-the-box monitoring solution.
Learn more