All Bridgetechs summary
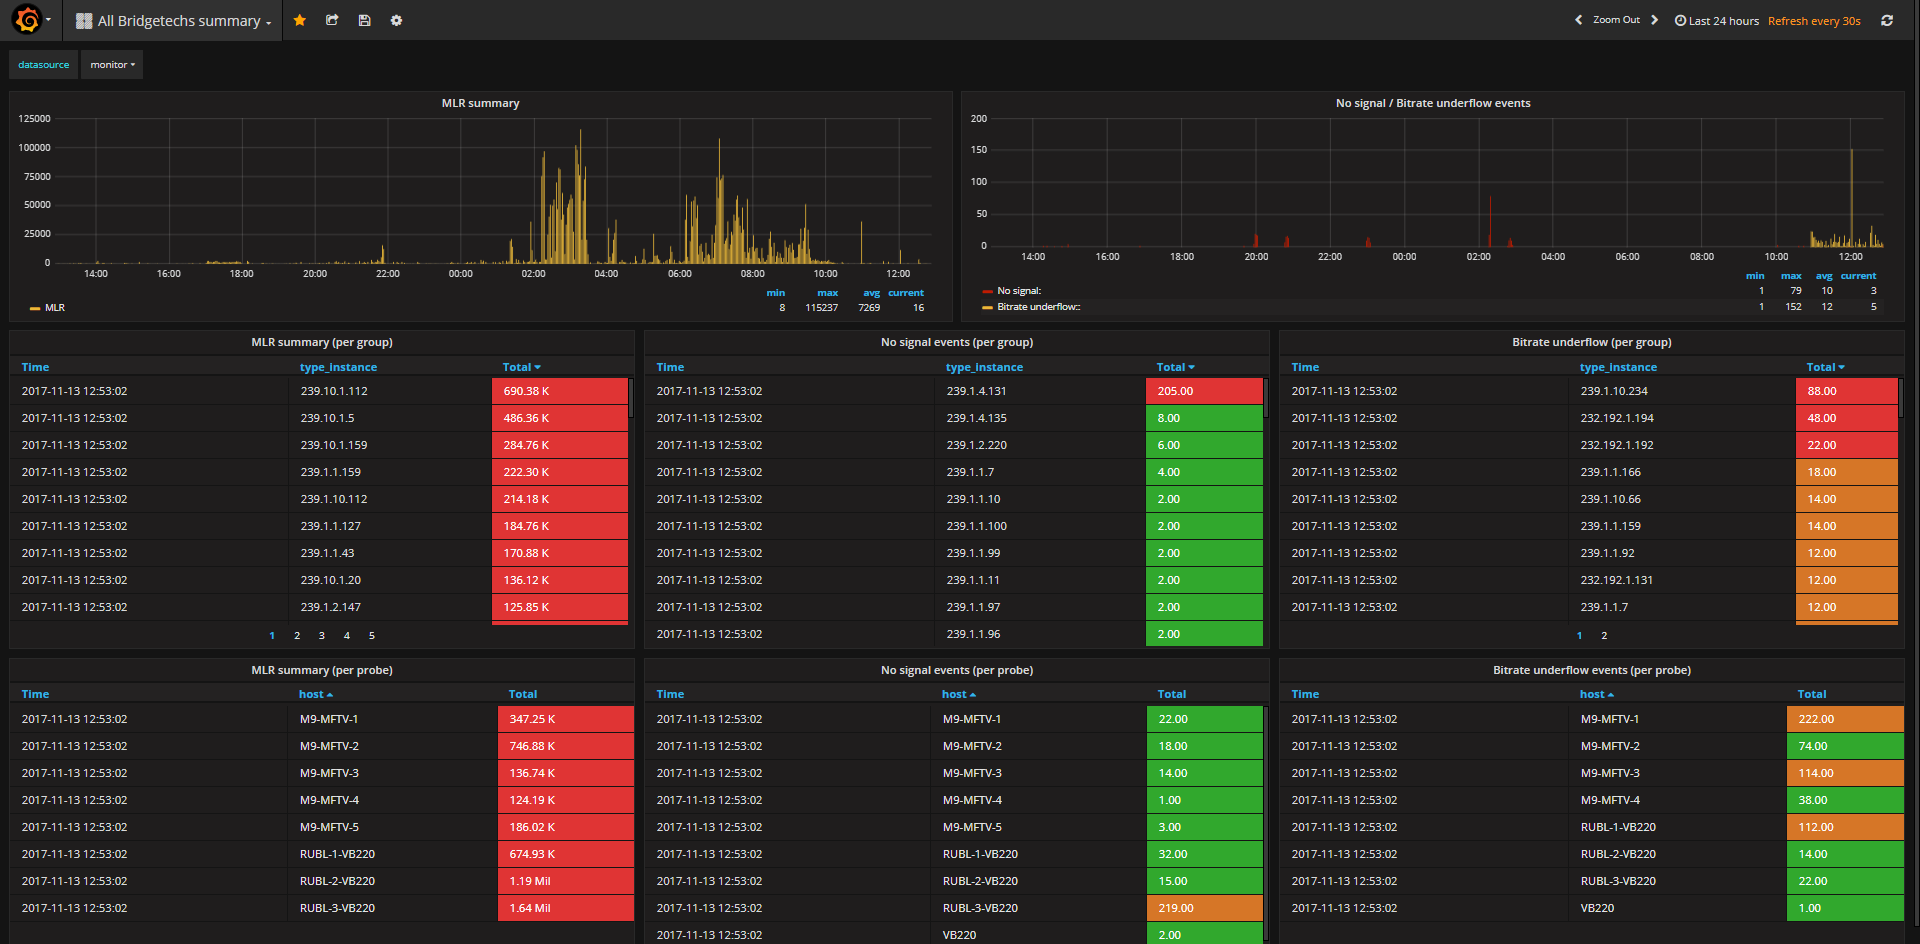
This Dashboard displays MLR, No signal and Bit Rate underflow events from Bridgetech VB220 probes through snmp traps.
Influxdb format example:
name: btech_stat time host type type_instance value
2017-11-09T08:44:31.65109979Z RUBL-3-VB220 mlr_error 239.1.1.155 75
2017-11-14T08:09:43.87758571Z M9-MFTV-3 br_uflow 239.1.1.155 1
2017-11-13T23:53:02.486077844Z RUBL-3-VB220 no_signal 239.1.1.155 1
Snmptt format:
EVENT btechTrap .1.3.6.1.4.1.24562.0.1 "Status Events" Normal
FORMAT New trap VB220 $*
EXEC /usr/lib64/nagios/plugins/grafana_vb220.pl $R "$6"
Perl script, what get data from snmp trap and put them to influxdb:
https://drive.google.com/file/d/10HX9a6uYNWwnuO8p3OwvErWhM4adawrp/view
Data source config
Collector config:
Upload an updated version of an exported dashboard.json file from Grafana
| Revision | Description | Created | |
|---|---|---|---|
| Download |