Endpoint Dashboard - MTR
This dashboard will display MTR results for a given network path between your MTR endpoint(s) and where your running the monitor from. The data source is InfluxDB, and the data model is defined in the mtr-monitor project on GitHub. https://github.com/carbolymer/mtr-monitor Enjoy!
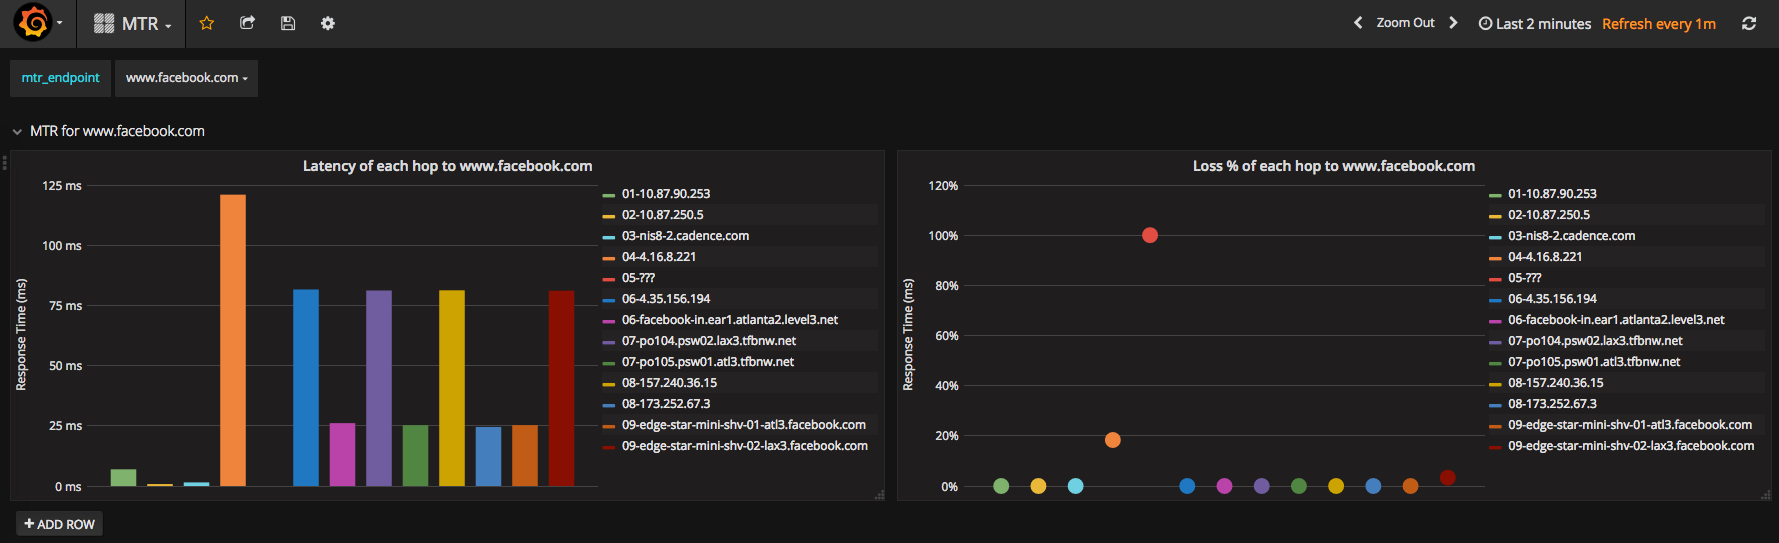
You can run the mtr-monitor project hosted in Github and point to your InfluxDB endpoint.
Data source config
Collector type:
Collector plugins:
Collector config:
Revisions
Upload an updated version of an exported dashboard.json file from Grafana
| Revision | Description | Created | |
|---|---|---|---|
| Download |
Metrics Endpoint (Prometheus)
Easily monitor any Prometheus-compatible and publicly accessible metrics URL with Grafana Cloud's out-of-the-box monitoring solution.
Learn more