Apache Traffic Server Dashboard
Apache Traffic Server Monitoring Template
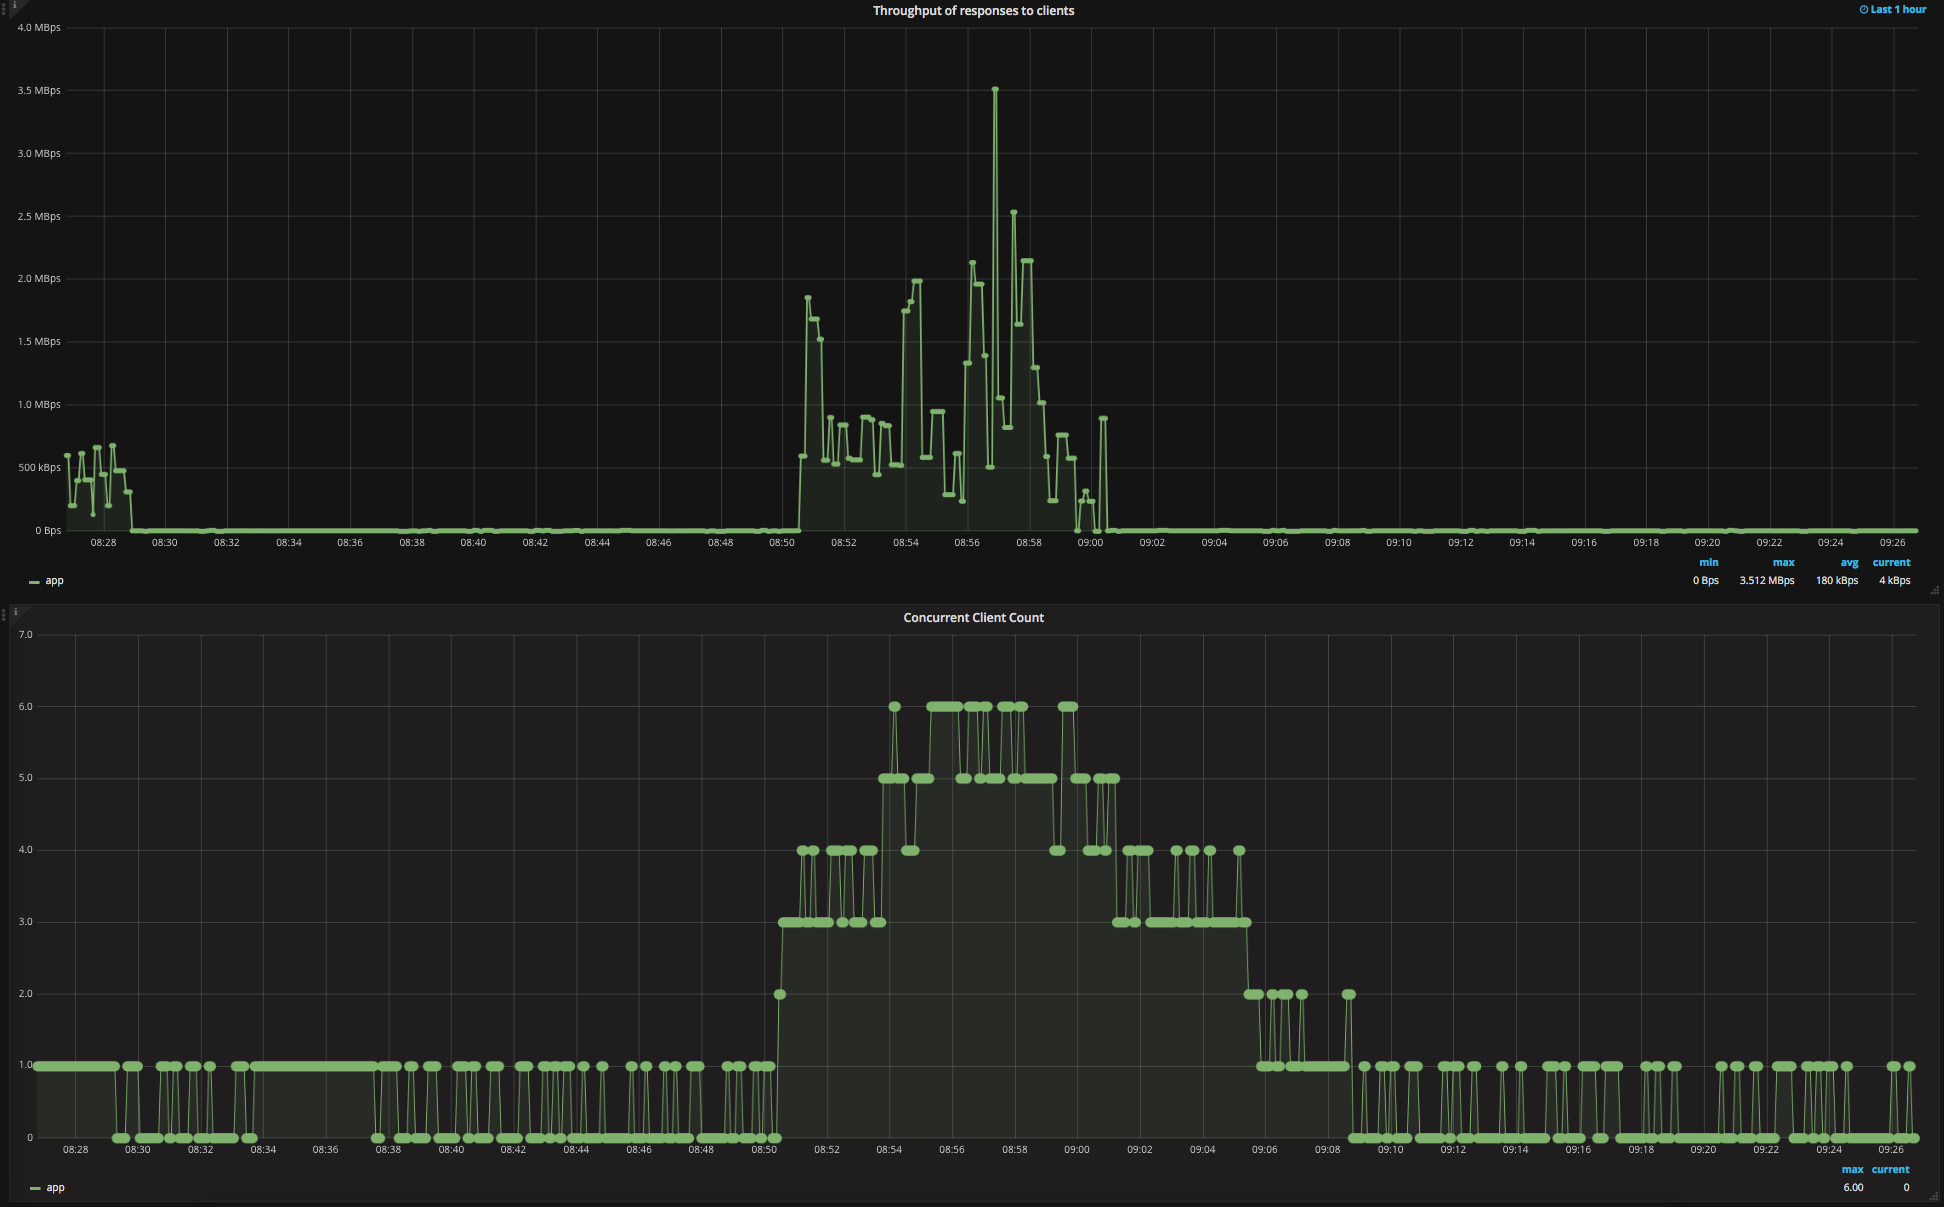
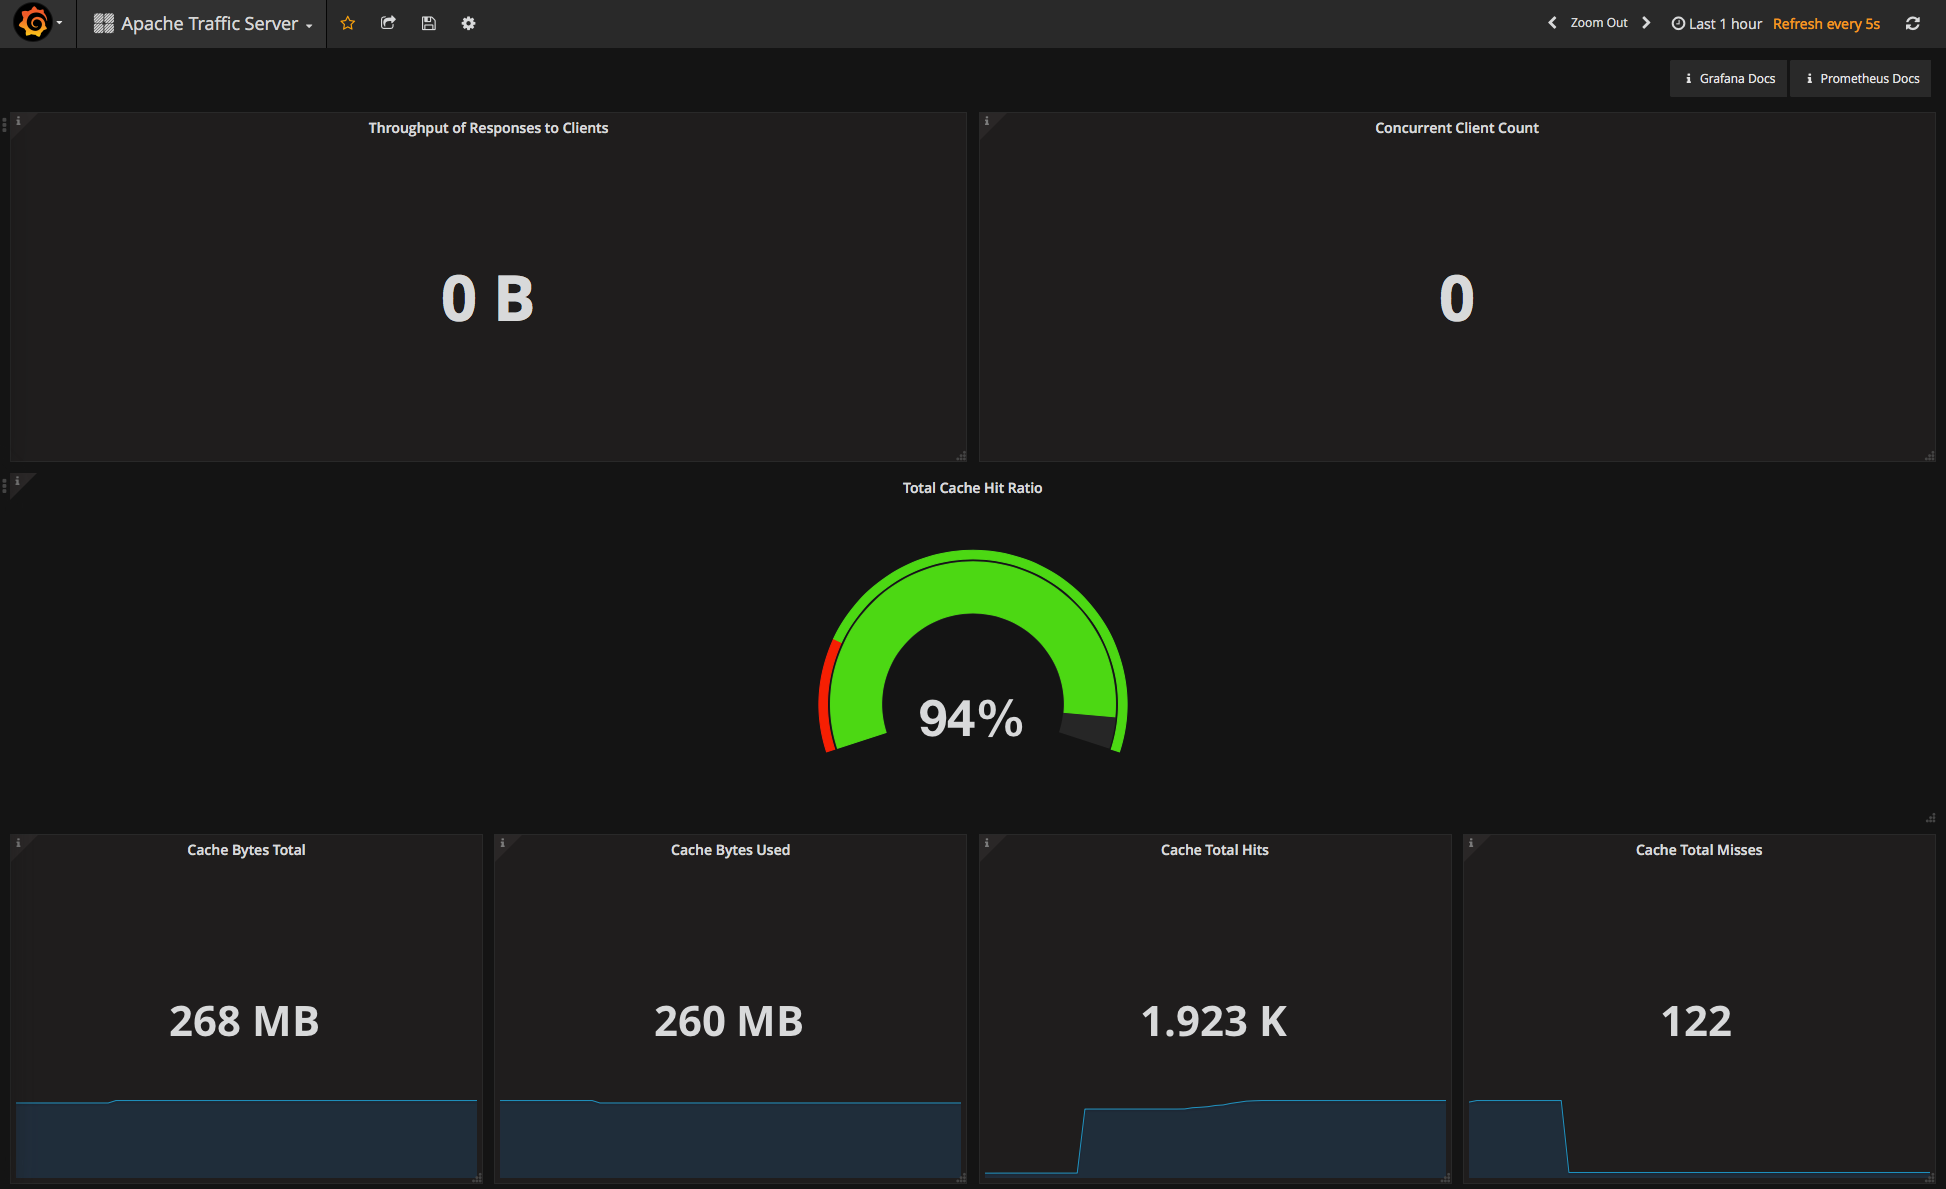
This is a dashboard for monitoring Apache Traffic Server metrics collected by custom exporter and stored in Prometheus TSDB.
If you have any suggestions or want to contribute, check https://github.com/buraksarp/apache-traffic-server-exporter.git
Data source config
Collector type:
Collector plugins:
Collector config:
Revisions
Upload an updated version of an exported dashboard.json file from Grafana
| Revision | Description | Created | |
|---|---|---|---|
| Download |